It’s October 3, 2025, and the federal government shut down two days ago for lack of budget legislation. It was not a surprise. Republicans holding power in the House of Representatives, the Senate, and the White House have made it a point not to negotiate a resolution, either among themselves (they had the power to resolve this all by themselves) or with the opposition party.
Citizens in the United States are becoming so used to dysfunctional federal government that the whole affair was met with a collective yawn on October 1. The pain will not hit immediately, and, when it does, most citizens believe it will not fall directly upon themselves.
Citizens in the United States have become so self-indulgent that pain which does not fall directly upon themselves does not matter.
In that context, all the follows may be a waste of time and computational effort. What follows is a quick look at the ongoing costs of a federal government shutdown on the state of Iowa. Iowa was picked because I am familiar with the data and I have a recently constructed economic impact model for Iowa. Similar calculations could certainly be done for any state.
The analysis will be done on the basis of a one-day shutdown. Results can be multiplied by the number of days the shutdown lasts to approximate total costs to the Iowa economy. Wherever possible, I will try to bring effects back to numbers of jobs lost.
To put this in perspective, over the past ten years, from December 2014 to December 2024, Iowa had a net gain of just 10 nonfarm jobs per day. Over the past year, from December 2023 to December 2024, Iowa had a net loss of 15.5 nonfarm jobs per day.
Federal Jobs
The first loss Iowa will see from a shutdown is the idling of federal employees. Iowa has about 18,400 federal civilian employees (Bureau of Labor Statistics – BLS). Most of them will be idled as nonessential workers. These employees generate an Iowa payroll of a little over $524,000 per workday (Bureau of Economic Analysis (BEA) and BLS). Like the rest of us, they spend their earnings on groceries, cars, clothes, dance lessons, and what-not.
When that payroll money does not get spent, someone else in Iowa doesn’t receive it. In general, taking half a million dollars out of Iowa payrolls will result in a loss of about 3.5 jobs. That means Iowa can expect to lose 3.5 jobs for every day the shutdown lasts. This is in addition to the 18,400 federal workers idled by the shutdown. This is a loss to the rest of us because those federal workers are not being paid and are not spending their earnings in the local economy.
Remember, over the past ten years, Iowa has generated only ten new nonfarm jobs per day.
Finally, this is not just workers. Idling federal workers will cost Iowa nearly $150,000 in business earnings (profits, rents, interest, etc.) for every day the shutdown continues. This is entirely from the effects of the unspent federal payrolls. This does not include the losses of federal contract or supply receipts or federal direct payments.
Direct Farm Payments
According to the Environmental Working Group, Iowa farmers received $43.5 billion dollars in direct payments over the past 30 years. This works out to an average of nearly $4 million per day, ever day, over the period. Because crops have already been cultivated this year, this is also best looked at as a subtraction from farm family incomes.
If we remove these sums from farm family incomes, farm families, like the federal employees above, will not be able to spend their funds on cars, houses, groceries, and what-not. This drop in expenditures means other Iowa families will not receive these expenditures as income.
The result of all of this is that reducing farm family expenditures by $4 million will reduce Iowa’s total employment by 26 jobs. It will reduce Iowa business earnings by $1.1 million.
On average, this will happen every day of the shutdown. The model is linear. The results can be multiplied by the number of days the shutdown lasts.
Remember, this will be in addition to the initial $4 million daily loss in farm family income.
Social Security Benefits
According to the BEA, Iowans received $15.5 billion in Social Security payments during 2024. This works out to an average of $42.5 million per day. This, too, is an addition to family income. When it does not arrive, recipients do not spend it on groceries, medical care, vacations, cars, and what-not. This reduces the incomes of Iowans who would normally supply these things to the recipients.
Reducing Iowa household income by the loss of daily potential Social Security payments would cost Iowa 278 jobs for every day that a shutdown stops Social Security payments. It would also cost Iowa businesses $11.7 million in lost earnings – every day that Social Security payments are not received. This is on top of and completely separate from the hardships imposed on Social Security recipients.
Medicare and Medicaid
The BEA reports that Medicare and Medicaid pumped $19.5 billion into the Iowa healthcare industry in 2024. This averages $53.2 million per day.
Unlike the impacts calculated above, these sums are not properly looked upon as changes to household income. Medicare and Medicaid payments are direct purchases of services from the healthcare industry.
Splitting these expenditures across the segments of the healthcare industry in Iowa results in a loss of 612 jobs for every day’s loss in Medicare and Medicaid expenditures in Iowa. It also results in the lose of approximately $21.7 million in business earnings across the state.
These estimates can be multiplied over the days payments are eliminated during a government shutdown.
These estimates are above and beyond the hardships imposed on recipients who are denied healthcare, and they are above and beyond additional costs that result from healthcare being denied.
Roll It All Together
Summing up the impacts laid out above, each day’s loss of the federal funding would cost 920 jobs and $34.6 million in business earnings. This would be above and beyond the direct loss of incomes and services to the initial recipients of the funds.
This would be multiplied every day receipts and services are lost due to a federal government shutdown.
Unlike a layoff at John Deere or some other manufacturer, however, these losses will be spread across businesses throughout Iowa and will not be reported to the Iowa Department of Workforce Development as mass layoffs. They will not be reported in the media the same way a mass layoff would be reported.
It will start as reduced hours, lost shifts, and scattered individual job losses, but the steady march of reduced expenditures, incomes, and employment will be insidious. The victims will be largely invisible except to their own small circles of family and friends.
And On and On and On We Go
Without going on ad nauseum, this is not all of it. According to Common Good Iowa, in 2024
The USDA spent $916.6 million in Iowa beyond direct farm payments
The Department of Commerce spent $1.4 million
The Department of Education spent $676 million
The Department of Energy spent $7.6 million
The Environmental Protection Agency spent $139.1 million
The Department of Health and Human Services spent $795.4 million in addition to its Medicaid outlays
Homeland Security spent $11 million
Housing and Urban Development spent $77.2 million
The Department of the Interior spent $30.5 million
The Justice Department spent $17.3 million
The Department of Labor spent $60.2 million
The National Endowment for the Arts and Humanities spent $1.9 million
The Department of Transportation spent $934.6 million
It all totals another $3.77 billion in federal spending in Iowa – an average of over $10 million per day. All of this could also be allocated to industries and run through an economic impact model, but you get the idea.
Most of us won’t directly feel the effects of a federal shutdown unless it lingers for some time. Although scattered, however, those impacts are larger on a daily average basis than the largest mass layoff reports that regularly make headlines in Iowa.
The invisibility of the victims magnifies the cruelty of these impacts and the irresponsibility of the people who made the shutdown a reality.
People talk about the “1%” as if it was something of the outer world. It is assumed to be a small cadre of individuals with seemingly infinite wealth who live in the economic stratosphere. This is not actually the case.
In 2024, there were only 813 billionaires in the United States. These people are the ones we often think of when we think of the “1%.” However, because there are 340 million people in the United States there are 3.4 million people in the “1%.” If you took away the 813 billionaires in the United States, there are still 3.4 million non-billionaire people in the “1%.” Almost all of us know some of them.
According to Investopedia, the minimum net worth to be among the “1%” was $13.7 million in 2023. This essay looks at one possible journey into this cohort. It starts with a simple model of farmland acquisition initiated by an inheritance. It shows how, over the course of 30 years, this can provide entrance into the “1%.” It concludes with some insights into the results of the process illustrated.
The Situation – Inheriting the Average Iowa Farm
Assume that one inherited an average Iowa farm in 1992. It consisted of 325 acres valued at $2,559 per acre in 2022-equivalent dollars. It was inherited it complete with the equipment and facilities required for operation. Assume it was inherited free and clear. It was paid off, and any inheritance and estate taxes and any other transfer costs were covered by the previous owner’s life insurance or a cash component in the estate. As a result, one acquired real estate (farmland) assets valued at $831,643 in 2022-equivalent dollars. (Some calculations may not be exact due to slight rounding errors in the presentation.)
We can build a model of the land value account of this operation utilizing publicly available data:
Number of farms, land in farms, and average farm sizes from the United States Department of Agriculture
Average Iowa farmland values per acre from Iowa State University
Average Iowa ag land rents per acre from the United States Department of Agriculture
Farm income and government payments information from the United States Bureau of Economic Analysis
The model is driven by land value appreciation and rental income (savings) per owned acre. Beyond the initial inheritance, additional land acquisitions are entirely funded by either capitalizing land value appreciation or in the form of cash purchases supported by accrued rental income (savings) in excess of mortgage payment needs. The amount of land value appreciation that can be capitalized is limited by the availability of rental income (savings) to fund mortgage payments. All dollar-denominated data is adjusted to 2022-dollar equivalents to facilitate comparisons and trends.
The rules to the model are listed below:
The land value account is isolated from other income. Land acquisition is supported by nothing other than the value appreciation and rental income (savings) generated by the initial 325-acre inheritance.
Rental income (savings) must be sufficient to cover mortgage payments at the time of any purchase or refinance.
Land can be purchased on terms of 40 percent down, 7.5 percent interest, and 20-year amortization with payments once a year throughout the period modeled.
The land is inherited in 1992, the first year in which we have complete single-source data.
The model runs through 2022, the last year in which we have complete data from the same sources.
The unencumbered value of the initial inheritance is utilized as collateral to purchase as much land as possible in 1993.
Following 1993, land is purchased and/or debt is refinanced every five years to whatever extent land value appreciation and rental income (savings) supports under the assumptions above.
At purchase points, accrued surplus rental income (savings) over mortgage payments is used to purchase land for cash as long as total purchases (cash and amortizations) total 10 acres or more.
Farm operating income and expenses, including property taxes are ignored.
From 1992 to 2022, the average acre of Iowa farmland appreciated at an average of $282.75 per acre per year in 2022-equivalent dollars. Over the same period, average farmland rents increased from $182 per acre to $256 (reaching a peak of $314 in 2014). These increases varied from year to year but have been significant over time. This farmland appreciation and increasing rental value provides significant leverage to increase wealth.
The table below presents the major items of interest. It covers the starting point (1992), the ending point (2022), and the purchase points throughout the period (1993, 1998, 2003, 2008, 2013, and 2018).
Our inheritor inherited 325 acres in 1992. It was valued at $831,643 and was free and clear. There were no loan or loan payments. At 1992 rental rates, it generated $59,006 in rental income (if rented out) or rental savings (if farmed by the inheritor) annually.
In 1993, the inherited acreage was fully leveraged to purchase an additional 491 acres. Our inheritor then had land assets of $2,070,614 and a mortgage of $1,246,158. Expected rental income (savings) of $150,175 annually is more than enough to cover the mortgage payment of $122,238. Any surplus of rental income (savings) over mortgage payments is accumulated. If sufficient, it is used for cash purchases of land at subsequent five-year transaction points. Any future appreciation in land values is capitalized at five-year transaction points to purchase more land up to the point where expected rental income (savings) is sufficient to cover mortgage payments.
Our inheritor will continue to make land purchases with capitalized appreciation and excess cash every five years to the extent possible. In 2013, the final land purchase is made. At that point, land holdings are 2,132 acres. This is 656 percent of the initial inheritance of 325 acres. In terms of dollar values, 2013 holdings are worth $22,934,292. This is 2,758 percent of the original inherited value of $831,643.
Land value increased substantially more than acreage because we constrained our mortgage obligations to levels where expected rental income (savings) could cover mortgage payments. Land values increased significantly faster than rental rates, so our inheritor was not able to capitalize a significant portion of land value appreciation. Had the inheritor faced lower interest rates or longer mortgage terms, it would have been possible to accumulate significantly more land and generate a significantly higher net worth.
In 2013, the land value account has a net worth of over $16 million. That is well over the $13.7 million needed to be a member of the “1%” in 2023. It took only 20 years of land value appreciation and rental income (savings) to raise a 325-acre inheritance to the “1%” level.
Land values hit a peak in 2013 and fell through 2018. Rental rates also fell. As a result, our inheritor could not purchase land in 2018. In fact, falling rental rates were insufficient to service the existing mortgage, so property needed to be refinanced in 2018 in order to spread remaining debt and lower payments to rent-serviceable levels. Refinancing was possible under model rules, but, unfortunately, net land value fell below $12 million.
By 2022, land valuations had recovered, but rental rates had continued to fall. This increased net worth but decreased the level of mortgage payments rental income (savings) could support. It is assumed that 2023 (which is just beyond the model) will require another refinance to spread remaining debt obligations and lower payments to a rent-supportable level. The net worth of the land value account is over $18 million. That put our inheritor solidly back into the “1%.”
It should be noted that there is nothing here about farming the land. Our inheritor could have rented the entire accumulated acreage out. While not of interest here, farming the land – no matter who farmed it – would have generated average of
$54.75 per acre per year in direct government payments
$120.72 per acre per year in operating income
$175.47 per acre per year in total farming income
Over the period from 1992 to 2022, farming these holdings would have generated a total of nearly $9 million. That would have averaged nearly $300,000 per year.
Things to think about
There are several things going on, here. First and foremost, these things are not at all unique to the farming industry. Ag land was used in the example because existing historical data makes it easy to consistently separate asset values and incomes from operational incomes in farming. The asset-value accumulations and the inheritance value advantages illustrated here are common across nearly all industries in the United States.
Contrasting Purchase to Inheritance
In the example above, we closed off the land value account from all other sources of funds. The acquisition process was initiated by the inheritance of 325 acres of unencumbered land. That inheritance was critical to the land value accumulation observed.
Suppose someone wanted to initiate this process by buying 325 acres of land on the same credit terms outlined above. That purchase would require collateral. Suppose that collateral was in the form of an unsecured loan at 7.5% interest (the same interest used in amortization throughout this analysis). We would initiate the model with
325 acres of land in 1992
$831,643 in land value
$498,986 in a bank mortgage with payments of $48,947 annually
$332,657 in unsecured debt
Whereas our inherited land in the example above was unencumbered and could immediately by leveraged to purchase more land, the land purchased here is completely leveraged and cannot support any additional purchases.
Because the land value account is closed, we consider the unsecured debt as an obligation that must be retired before additional land can be purchased. Funds for this can be acquired in two manners:
Land value appreciation can be capitalized to pay the unsecured debt. In effect, this trades increased mortgage balances for decreased unsecured balances. This is limited by both the amount of land value appreciation and the amount of mortgage payments that can be supported by rental income (savings).
Increases in rental income (savings) generate surplus cash that can be used to pay off the unsecured debt.
In 1998, 2003, and 2008, increased rental income (savings) is used to restructure the bank mortgage, capitalizing all the land value appreciation that rental income (savings) can service as mortgage payments. The entire value of this increased mortgage in each period is utilized to buy down the unsecured debt. There are no additional funds for land acquisition.
Restructuring in 2013 is sufficient to completely clear the remaining unsecured debt and to purchase an additional 27 acres of land. This is the only land acquisition that will be made in this scenario. As in the discussion above, land valuations and rental values fell from 2013 to 2018. In 2018, mortgage debt had to be refinanced to spread remaining debt and lower payments to a level supportable by rental income (savings). Rental values continued to fall through 2022. It is assumed that mortgage debt will have to be restructured again in 2023 (which is beyond the model) to lower payments so they can be supported by rental income (savings).
At the end of the model period, our purchaser has
352 acres of land, versus 2,132 acres accumulated by our inheritor
$3 million net worth in the land value account, versus $18 million accumulated by our inheritor
Recall that, in both scenarios, the land value account is closed. It is driven by land value appreciation and market rental rates regardless of whether our owner farms the land or rents it out. Had our land purchaser farmed these acres, it would have generated $1.77 million in farm income over the period, or an average of almost $59,000 per year. Our inheritor, on the other hand, would have generated nearly $9 million in farm income for an average of nearly $300,000 per year.
Intergenerational Implications
In the current tax environment, neither of our landowners would be in a position where their assets were subject to estate taxes when they die. In most jurisdictions, their heirs would not be subject to inheritance taxes. This has tremendous intergenerational implications.
Suppose our original purchaser and inheritor both die in 2022. Sufficient land is sold to cover their remaining mortgage debts and rental income (savings) shortfalls, and their land is bequeathed to heirs prior to the end of 2022.
We assume that property sold to cover existing debts is subject to capital gains taxes totaling 23.98% at the national and state level. We assume that any remaining property passes to the next beneficiary tax free. We also assume that the basis of any inherited land is stepped-up upon inheritance, freeing the beneficiary from any capital gains that had accrued to the deceased owner.
In order to clear $5.4 million in outstanding debts, our inheritor’s estate liquidates a total of 515 acres of land. Disposing of the highest-basis land acquisitions to minimize capital gains taxes covered both the outstanding debts and a $273,863 capital gains tax obligation (an average of $530 per acre sold).
At the conclusion of these transactions, our inheritor’s beneficiary is bequeathed 1617 acres of land valued at nearly $17.9 million. Of this, $12.9 million was acquired as capital gains by the previous owner. Stepping up the beneficiary’s basis is equivalent to a gift of $3.1 million in foregone capital gains taxes (over $1,900 per bequeathed acre).
It should be noted that, even had the estate or beneficiary paid or retained liability for these taxes, the beneficiary would still have received land of sufficient value to remain among the top “1%.” All of this results from the simple appreciation of the inheritance of an average Iowa farm over 30 years. Within this land appreciation model it has not even been necessary for the original inheritor to farm the land. Rental values and appreciation were all that were required to generate this result.
Alternatively, consider our other example, the individual who bought 325 acres in 1992. At the point of death in 2022, the value of land owned is nearly $3.9 million. Debts are $779,863. In order to clear debt, this estate liquidates 81 acres of land. This includes the 27 acres purchased in 2013 and 54 of the original 325 acres purchased in 1992.
The sales result in a capital gains tax obligation of $112,180 or $1,385 per acre sold. Note that this is over 250% of the per-acre capital gains tax obligations for our original inheritor. This is because our inheritor was able to continue acquiring land as land appreciated. This increased his basis on land sold, which reduced his capital gains on transactions. Our original buyer was able to acquire only 27 additional acres over the model period. The majority of his sales came from land with 30 years of capital gains.
After the land sales, our original owner’s beneficiary is bequeathed 271 acres valued at nearly $3 million. Of this, $2.3 million accrued as capital gains to our original purchaser. Stepping up the basis of this farmland at inheritance is effectively a gift of a little over $551,000 to our original purchaser’s beneficiary ($2,034 per acre bequeathed).
Questions of Equity
If we were able to continue the model, we would start with two beneficiaries:
Heir A: our original inheritor’s heir bequeathed 1617 acres
Heir B: our original purchaser’s heir bequeathed 271 acres
In 2023, our two heirs would be able to leverage their unencumbered inheritances. Heir A could purchase 2,425 acres for a total of 4,048 acres with 40% equity. Heir B could purchase 406 acres for a total of 677 acres with 40% equity. This is where cycle number two begins.
There are clearly issues of equity revealing themselves. Recall that we did not expect any of the owners to farm their land. They did nothing other than fully exploit their passive income from rents and their passive appreciation in land values. There is no difference in behavior or apparent merit between our participants, yet their opportunities at the outset of any cycle are vastly different and are diverging.
In addition to the disparity noted above, there are serious concentration problems. To begin the first cycle, our two participants each acquired one average sized farm (325 acres of land). At the end of the cycle, they bequeathed 1,888 acres. In effect, they concentrated nearly 4 additional average sized farms into their two operations. To start the second cycle, our two heirs immediately purchased an additional 2,831 acres of land. Even given an increased average farm size of 345 acres, this transaction concentrated another 8.2 average-sized farms into their two operations. The relative ease with which inheritors can multiply their holdings stands in stark contrast to the opportunities available to new purchasing entrants (recall our first generation, above).
Assuming that this cycle of land value increases over 30 years is consistent, in less than 6 generations (30-year cycles) our two current heirs will have accumulated land in excess of the current farmland total in Iowa. This is unstable just between the two of them. Assuming they are not alone, the individual advantages proffered by inheritance will almost certainly lead to an unstable and unsupportable farmland market in a couple of cycles.
The situation our model illustrates is a market failure. We have two individuals who cannot be distinguished with respect to market performance yet see inevitably diverging economic outcomes. In addition to that, we have a rapidly concentrating land market that inhibits market competition and competitor entrance. Furthermore, we have inheritance and capital gains tax environments that exacerbate the problems illustrated.
Conclusion
At the outset, we noted that the majority of the top “1%” is not otherworldly. Our model demonstrates that a relatively common inheritance and equity appreciation can move an individual into the “1%” in the course of a single generational cycle if that individual diligently exploits and capitalizes unearned incomes and equity appreciation. Our model also shows that individuals starting from scratch with similar assets cannot match the results of inheritors, even if no distinction can be made between them in terms of economic merit.
This points to economic failures that could and should be addressed by the estate, inheritance, and capital gains tax environments. If we are going to provide opportunity to every individual, we need to assure that the accumulations of previous generations do not override the potential of current participants.
Increasingly, we live in a world where the federal funding we have integrated into our local economies cannot be relied upon. At the same time, there are no guarantees that the lost funds will be returned to the economy in other forms if they are removed. There is substantial talk of deficit reduction and of selective tax cuts, but there is no sign that funds held at the federal level will be broadly distributed to the local economies which will bear the loss.
This is a simple analysis of what the Iowa economy would look like if four major flows of federal funding were cut off:
Agricultural Subsidies
Social Security
Medicare
Medicaid (the federal share only)
No assumptions are made of any alternative flows that would replace these losses. This is simply a look at general expectations assuming these funding flows simply disappear.
Data for this exercise were collected for 2023. This is the last year for which the full range of data could be obtained. All data except the level of agricultural subsidies was sourced from the United States Bureau of Economic Analysis (BEA). Agricultural subsidy totals were obtained from the Environmental Working Group, because the BEA has recently stopped publishing detailed agricultural industry statistics at the local level.
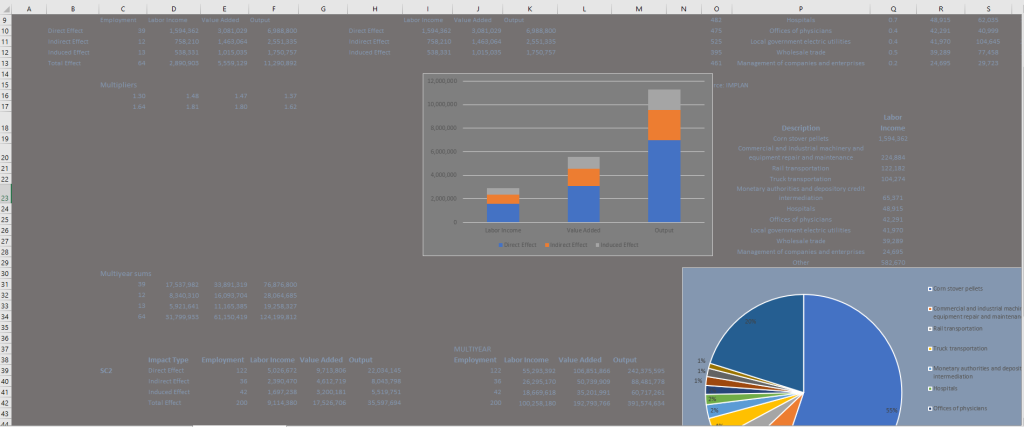
The effects of removing each of the four funding flows were analyzed using an impact model built with Iowa economic coefficients obtained from the BEA Regional Input-output Modeling System (RIMS II). Each of the four major funding sources was run separately, sums were taken, and a comparison was made to Iowa totals for actual 2023 gross domestic product and employment. The table below shows the results. Dollar values are in billions.
What all falls out is a loss in federal funding of almost $30 billion. As these losses percolate through the Iowa economy, they will result in
Lost economic transactions totaling $42 billion
Lost economic value added (GDP) totaling $24 billion
Lost business income, interest payments, rents, and direct production taxes of $10 billion
Lost labor income (payrolls) of nearly $14 billion
Over 268,000 jobs lost
At the end of the day, Iowa can expect to see its GDP drop by almost 12 percent and its employment totals to drop by 12.5 percent if these funding flows are terminated without replacement. Iowa is not unique among states with respect to the expected impacts if major federal funding streams dry up.
Additionally, we can use payrolls as a proxy for production and income to roughly estimate Iowa tax losses resulting from this. Iowa collects approximately 8.75 cents in general revenue for every dollar in statewide payroll. At this rate, the loss of payrolls resulting from losing federal flows of funds would result in a reduction of state general tax revenue by over $1.2 billion. This would further cut expenditures throughout the state and magnify the losses listed above.
Regardless of the pros and cons of government interventions in the economy, the economy has been built up over decades on the incentive systems driven by those interventions. It would behoove us all to be a patient and cautious in making changes.
The Iowa Legislature is currently working on a bill (SF 615) to impose work requirements on able bodied adult recipients of Medicaid. The bill passed the senate on Tuesday, March 27. It was passed with amendments by the house on Wednesday, March 28, and sent back to the senate. It will likely be passed and signed into law during the week of March 31, 2025.
On the face of it, it is kind of hard to figure out what this means. The governor apparently put forth the bill, but neither the governor’s office nor the departments of health & human services, public health, revenue, or management & budget provided any information to the Legislative Service Bureau on costs, savings, or fiscal implications of the bill.
Either they don’t know, don’t care to know, or don’t want anyone else to know the implications of SF 615. One can easily find estimates on the internet that 75 percent of Iowa adults on Medicaid already work, but it is hard to determine the potential exemption status of the other 25 percent.
To its credit, the Legislative Service Bureau did provide some important estimates to underpin the analysis presented here:
The bill will generate Medicaid savings of $3.1 million to the State of Iowa in the first year
The bill will generate savings of $17.5 million in the second and subsequent years
The funding percentage split between federal and state is 88.4 percent federal and 11.6 percent state
This means that when the state saves $3.1 million in the first year, the federal government will save $23.6 million, and when Iowa saves $17.5 million the second year, the federal government will save $133.4 million. Summing these up, during the first year while the State of Iowa is saving $3.1 million it will be cutting health care expenditures in the state by $26.7 million. During the second year the state will save $17.5 million by cutting statewide health care expenditures by $150.9 million.
So far, this has all been derived directly from the estimates made by the Legislative Service Bureau.
The United States Bureau of Economic Analysis (BEA) generates estimates of expenditures for each state. Assuming the healthcare expenditures eliminated by SF 615 are spread through the system on an equivalent basis to Iowa’s overall health expenditures, they can be run through an input-output model to see how they will affect the entire Iowa economy. The model was set up using coefficients available from the BEA.
Four scenarios were set up – two each for first year and for second year reductions in health care expenditures. In the first scenario for each year, health care expenditures were cut, and no other changes were made. In the second scenario for each year, it was assumed that the State of Iowa’s estimated savings were concurrently returned to taxpayers as household income (equivalent tax cut scenarios spread proportionately to income distributions).
Scenario One: First year health care expenditure cuts without equivalent tax reductions
State of Iowa savings – $3.1 million
Health care expenditure cuts – $26.7 million
Statewide payroll reductions – $17.3 million
Statewide jobs reduction – 307 jobs
Reduction in statewide returns to capital (profits, interest, rents, etc.) – $10.9 million
Job losses will fall predominantly in these sectors:
Health care – 189
Finance & real estate – 28
Professional, management, & administrative – 23
Wholesale & retail trade – 21
Additionally, a very rough estimate of state general revenue fund tax loss can be made by dividing state net tax deposits (Iowa Department of Revenue) by earnings by place of work (BEA) for Iowa. That calculation results in 8.75 cents in general fund tax deposits per dollar of payroll in the state.
This estimated tax loss would be $1.5 million. It would not include losses in non-general state income, such as the lottery or liquor, and it does not include local government receipts, but it would still amount to approximately half of the state’s anticipated savings from restricting access to Medicaid.
Scenario Two: First year health expenditure cuts with equivalent general tax reductions
State of Iowa savings – $0 (all savings are distributed in an equivalent tax cut)
Health care expenditure cuts – $26.7 million
Statewide payroll reductions – $16.4 million
Statewide jobs reduction – 287 jobs
Reduction in statewide returns to capital (profits, interest, rents, etc.) – $10.0 million
Estimated general revenue tax losses – $1.4 million
Job losses will fall predominantly in these sectors:
Health care – 185
Finance & real estate – 24
Professional, management, & administrative – 21
Wholesale & retail trade – 17
Scenario Three: Second year health expenditure cuts without equivalent tax reductions
State of Iowa savings – $17.5 million
Health care expenditure cuts – $150.9 million
Statewide payroll reductions – $97.7 million
Statewide jobs reduction – 1735 jobs
Reduction in statewide returns to capital (profits, interest, rents, etc.) – $61.5 million
Estimated general revenue tax losses – $8.5 million
Job losses will fall predominantly in these sectors:
Health care – 1068
Finance & real estate – 155
Professional, management, & administrative – 128
Wholesale & retail trade – 119
Manufacturing – 38
Scenario Four: Second year health expenditure cuts with equivalent general tax reductions
State of Iowa savings – $0 (all savings are distributed in an equivalent tax cut)
Health care expenditure cuts – $150.9 million
Statewide payroll reductions – $92.9 million
Statewide jobs reduction – 1620 jobs
Reduction in statewide returns to capital (profits, interest, rents, etc.) – $56.7 million
Estimated general revenue tax losses – $8.1 million
Job losses will fall predominantly in these sectors:
Health care – 1047
Finance & real estate – 134
Professional, management, & administrative – 121
Wholesale & retail trade – 95
Manufacturing – 33
Some thoughts
Regardless of the merits of imposing work requirements where the great majority are already working (recall that the governor and affected state departments declined to provide details regarding those merits), this is not simply a state budget reduction effort. It will significantly affect payrolls, employment, profits, and tax receipts across the state.
These effects are magnified by the fact that the federal government multiplies Iowa’s investment. For every dollar the state puts into these benefits the federal government contributes $7.62. That means that for every dollar the state saves with SF 615, the state forgoes $8.62 in economic activity that generates payrolls, employment, profits, and tax revenue. The state savings of $17.5 million per year will cost the state’s economy almost $151 million in expenditures (economic activity) per year.
The magnitude of these losses, particularly in the health care industry, will force providers to abandon billions of dollars worth of investments in facilities and infrastructure. These abandonments will not magically reappear if SF 615 is subsequently modified or repealed.
It should also be noted that, as expenditures fall, payrolls are cut, profits disappear, and jobs are axed it will be harder for Medicaid recipients to find the required jobs. This will remove more of them from Medicaid. This will save the state more money. For every dollar saved in this manner, another $8.62 in health care expenditures will be removed from the economy and the cycle of disruption to the state’s economy will continue to expand.
These are a costs that deserve more analysis than the governor or the statehouse has given.
None of these dealt directly with the typical small-government argument that an offsetting reduction in taxes will eliminate the adverse effects of eliminating programs.
This argument is not actually true in most cases. The reason is that markets are not neutral. They are created within the context of government intervention, and government intervention is required for efficient markets to function over time. Government defines and enforces property rights. Government oversees the accessibility and stability of the money supply. Government regulates financial transactions. Government influences marginal propensities to spend resources on and between categories of goods and services through taxation, investment, and program regulations and expenditures.
For better or for worse (I am not arguing one way or another), these influences shape markets, private investments, employment, and income. Making substantial changes to the way government influences the shape of markets and the economy will generally cause significant disruptions in the system. Those disruptions generally do not even out among all participants.
This analysis looks at the effects of eliminating federal Medicare and Medicaid benefits in Iowa and replacing them with equivalent increases in household income through tax reductions (see, in particular, Breaking Medicare and Medicaid – An Economic Perspective from Iowa). To develop this perspective, I
Set up a model of the Iowa economy
Removed $14.3 billion from the specific industry groups Medicare and Medicaid funding flow into
Added $14.3 billion to general household income
By both removing and adding $14.3 billion from/to the Iowa economy, the net initial impact on available resources is zero. The difference between where resources are removed and where resources are added, however, still results in devastating impacts upon the Iowa economy.
The change in how this $14.3 billion is allocated in the existing economic structure will result in a statewide payroll reduction of $5.6 billion reflected in the loss of over 70,000 jobs. Not all industries would lose jobs however:
Finance and real estate would see an increase of over 2,000 jobs
Wholesale and retail trade would see an increase of over 7,000 jobs
Education and the arts would see an increase of over 3,000 jobs
Accommodation and food service would see an increase in almost 2,000 jobs
On the other side of the coin
Health care would lose over 80,000 jobs
Professional services, management, and administration would lose over 7,000 jobs
These consequences would occur because markets are not neutral. They have been shaped for over 200 years by government interventions is property rights, taxation, expenditure, and regulation. An immediate and substantial change to the rules of the game can be expected to break down large segments of the economy that those rules have helped build up.
Regardless of philosophies regarding the long-term merits of one government-influenced market regime over another (and make no mistake, changes in government intervention only change the shape of government influence on the market – they do not eliminate that influence), it is important for the health of the economy that substantial changes be made slowly.
Furthermore, it is almost certain that the negative economic effects outlined above are understated. It will be worse than the results of the model shown above. It will be worse across all categories. Worse for the modeled winners as well as for the modeled losers. The reason is simple. The increases in household income (reductions in taxes) will not accrue to the same people who suffer losses of benefits.
In the model, the tax reductions were treated as increases to general personal income across Iowa. This assumes that tax reductions were proportional to incomes across the economy. That means that the people that lost Medicare and Medicaid benefits would be net losers in the transaction and everyone else would receive an unearned windfall.
A large proportion of this unearned windfall would go to high-income households with lower propensities to consume. This will result in a significant portion of the offsetting increases in income being removed from the economy as savings or financial investments. This would result in significantly lower offsetting economic activity than the model assumes. That, in turn, means the model results presented above are unrealistically optimistic.
In reality, however, this unearned windfall, these tax reductions, would not be spread proportionately across incomes within the economy. The current tax system and current proposed tax reforms heavily favor upper income households over lower income households (taxation policies are a major avenue through which government shapes the economy – see Why We Can’t Make Nice Things….). As a result, a predominant share (rather than the proportional share discussed in the previous two paragraphs) of offsetting personal income will accrue to upper income households. This will magnify the effect of lower marginal propensities to consume discussed in the paragraphs immediately above and further reduce the effect of offsetting income on benefit losses depicted in the model. For this reason, again, the economy-wide results modeled above are unrealistically over optimistic.
Regardless of the philosophical merits of any one form of government intervention over any other in shaping the economy, significant changes in these forms of intervention should not be made abruptly or haphazardly. The analysis above is clear that eliminating Medicare and Medicaid benefits in Iowa and replacing them with equivalent increases in household income through tax reductions will have a large negative impact on the Iowa economy. Markets are not neutral. They are shaped by the government. As a result, government has a responsibility to be responsible in changing the rules.
On February 6, 2025, I posted a note on the closure of the United States Agency for International Development (USAID). Regional Strategic, Ltd. turned down a contract to analyze the economic impact of that closure on an area of the Upper Midwest, because, in concert with the closure, the administration foreclosed access to data documenting USAID’s purchases and expenditures. The government actively denied the public the ability to evaluate government actions.
That denied my company the ability to conduct meaningful analysis for an industry group that needed to make immediate plans. That, in turn, foreclosed the generation of business incomes (and the residual personal incomes) on both sides of the potential transaction.
The note indicated that this was not the only case of data access restrictions occurring under the new administration in Washington, D.C. At that point, two weeks into the administration, data on healthcare, weather, and climate change that undercut the administration’s political positions had already been removed from public access. The note detailed some of the commercial problems these data restrictions would cause.
Yesterday, the administration moved again to restrict and/or alter major data streams available from the federal government. This time it was the Department of Commerce (USDOC). The USDOC is one of the major sources of data in the federal government. Data agencies within the USDOC include
The Census Bureau (Census) – which collects data on population, demographics, housing, employment, income, commercial activity, and international trade. These data streams are used to allocate congressional and state legislative seats, benchmark the National Income and Product Accounts (NIPA), manage and evaluate congressionally mandated programs, and determine the need for and effects of tariffs and trade restrictions.
The Bureau of Economic Analysis (BEA) – which is the national accountant. The BEA consolidates and analyzes data from the Census, the Bureau of Labor Statistics, the Department of Agriculture, and the Treasury to provide the consistent production, employment, income, and consumption data to generate the NIPA, which, in turn, is the source of national income and gross domestic product statistics.
The International Trade Administration (ITA) – which collects data on our international trade and the trade positions of our trading partners.
Sounds like pretty dry stuff, but this data underpins nearly every
Piece of market research
Investment decision
Community economic development plan
Interest rate
Bond issue
Congressional revenue and expenditure enactment
made in the United States.
On a personal level, this data underpins a complex integrated financial system that supports your auto loans, mortgages, and credit card transactions – all of which will get significantly more expensive as the quality and consistency of these data streams deteriorates.
The accuracy and consistency of these data streams is critical to business decisions, government action, and personal income.
On Sunday, March 2, 2025, Howard Lutnick, Secretary of Commerce, announced his intention to strip government activities from gross domestic product data. On Tuesday, March 4, 2025, he announced the disbanding of two important advisory boards:
The Federal Economic Statistics Advisory Committee
The Bureau of Economic Analysis Advisory Committee
These committees are made up primarily of professional and academic statisticians that advise the USDOC on proper data handling and increasing the quality and precision of the data and estimates the government produces and disseminates. To be effective, however, committee members need to be made aware of changes being made and how those changes are being accomplished.
Over the past five days, the federal government has, in quick succession,
Announced its intentions to make one of the most radical changes to federal data systems in modern memory
Dismissed the very experts it would need in order to accurately and successfully accomplish these changes.
While much of the general public is not aware of these data streams on a daily basis, interrupting them is a major affair that will directly and significantly affect their livelihoods if not done correctly. It will be infinitely more disastrous if these disruptions are done politically.
This is a big deal that should command more attention than it is getting.
Post script
The list below is of posts I have made over the past 15 months that would not have been possible or accurate without the consistency of the data streams put at risk over the past five days. These are just short musings I have put up as examples of what can be done.
They do not include the extensive market reports I have generated for Midwest businesses and industry groups, economic impact studies I have done for the likes of John Deere, Des Moines University, the Iowa Off-Highway Vehicle Association, the National Balloon Classic, and others, or the policy analyses I have done for agricultural commodity groups. None of these efforts would have been possible without consistent quality data streams on the economy.
Beyond this, most people don’t spend their lives with there noses in the data. Most who do perform internal statistical analysis and do not work with the economic and social environments that underpin economic and policy analyses. Removing or corrupting the data streams discussed above will eliminate the jobs of hundreds of thousands of folks like me that connect the data to markets, the economy, development initiatives, and social and recreational initiatives.
Yesterday, Regional Strategic, Ltd. was asked to evaluate the effect shutting down the United States Agency for International Development (USAID) would have on demand for agricultural commodities in a specific area of the Midwest. We had to decline the project. After looking at available data, we found that, in shutting down the USAID website, the administration had denied citizens and the business community the ability to evaluate what had been lost and plan for the alternatives that remained.
The question is not trivial. It appears that USAID acquired approximately $1.8 billion in U.S. food products to support its activities in 2022. Every $100 million spent on food production and processing in the upper Midwest generates approximately
$100 to $120 million in value-added economic activity within the Midwest
$55 to $70 million in labor income
$30 to $65 million in corporate profits and tax revenue
1,000 jobs
Any of these estimates could be increased 18 times to accommodate the $1.8 billion demand loss from eliminating USAID. All of these totals would go up if the impact was evaluated across the entire United States.
Clearly, local regions that are heavily invested in commodity production and processing would like to evaluate what portion of existing demand is being taken off the table:
Every $100 million reduction in 2022 Iowa corn purchases in Iowa would have been equivalent to idling over 75,500 acres of 200-bushel corn
A similar reduction for wheat in Kansas would have been equivalent to idling over 310,000 acres of 37-bushel wheat
The sudden lack of data with which to evaluate these impacts on local areas is a business issue. It is a family welfare issue. It is an employment issue. It is a public policy issue.
This is not limited to the situation involving USAID. In the first two weeks of the present administration, data access has been restricted in the areas of health care, climate, and weather forecasting where those data run counter to the administration’s political inclinations. This is bad for business, and it is dangerous.
Health data is being restricted at a time when the United States is experiencing a growing bird flu epidemic, Africa is experiencing renewed Ebola outbreaks, and drug-resistant tuberculosis is becoming more prevalent worldwide. Any one of these situations could rapidly become an international health problem. Any one of these is a personal safety issue. Each of these could rapidly become a workforce issue.
Weather and climate data are critical for construction, shipping, food production, tourism, energy distribution, and many other industries. Data on income, trade, consumption expenditures, and demographics are critical to any business doing market, workforce, or facility siting analysis. In any of these cases, businesses that rely on private vendor subscriptions are not immune, as their private vendors all depend upon public data sources as foundations for their models.
Given the rapidity of data “Disappearances” in the first two weeks of the administration, we don’t expect it to stop. There is plenty of information that contradicts the administrations political proclivities in the Bureau of Economic Analysis, the Bureau of Labor Statistics, the Census, the Energy Information Administration, the International Trade Administration, the Department of Agriculture and other agencies. We anticipate that many of these sources will disappear or become restricted in the coming months. Restriction of any one of these would have major implications for significant portions of the economy.
The situation is made more critical by online data access and delivery. Thirty years ago, data histories for all these sources were published and available in libraries across the country. That is no longer the case. Unless restrictions are anticipated and data is downloaded, catalogued, and stored, even data histories will be unavailable. The reduction in publication and distribution costs has resulted in more and better data over the intervening period, but it has also put citizens and business at risk under the current administration.
There has always been public data that made elected officials uncomfortable. The current difference is that the administration is not willing to address and live with its discomforts – opting instead to eliminate the evidence of its contradictions.
THIS IS A BUSINESS ISSUE. It is time for businesses to step up to help resolve it.
We have recently been engaged in some demographic analysis of voter data here at Regional Strategic, Ltd. While a lot of news is made with exit polls on election day, those polls are seldom representative of the population as a whole. News organizations position pollsters at select stations, but they don’t have the resources to cover the gamut of socio-economic areas represented by precincts nationwide. They rely on sampling frames (see our November 24, 2024 blog at www. regionalstrategic.com/wp/the-moveable-middle-statistics-information-progress/ for some thoughts on sampling frames) which rely on expert insights that may have as much to do with news value as with statistical coverage.
After the fact, substantial voter analysis can be done with official statistics. Regional Strategic, Ltd. is supporting some analysis in Iowa utilizing data from the Iowa Secretary of State’s office:
The January 6, 2025 release of the Iowa Voter Registration Database. This includes all Iowa voter registrations on January 6 and information on their voting history. January 6 is the first release that includes 2024 general election information for all current registrants.
The Official Canvass by County, which includes vote totals, undervotes, and overvotes for every state and federal office contested in the election on a county level.
Precinct Results by County, which brings vote counts down to a precinct level.
The Iowa Voter Registration Database is the largest of these. It comes in at more than 2.2 million records with 132 fields. It offers information on voter age, sex, location (address, county, precinct) and voting history. It comes in multiple files for each of four congressional districts.
The first step is to combine files by district. The entire state is too big to conveniently handle in Excel. The 3rd Congressional District was consolidated and cleaned up. There are always some broken and/or incomplete files. This isn’t due to malfeasance or incompetence. In a world where taxpayers insist on paring government functions to the bone, there simply is not enough help to adequately process the masses of data and sources of data that must be reconciled. This scarcity of resources is also evident in the period of two months that is necessary to release files after an election.
The 2025 registration file is an improvement over recent periods. Only 10 damaged records were encountered in the 569,000 records for the 3rd Congressional District. These were all successfully reconciled into 4 complete records. As a result, the 3rd Congressional District file for analysis contained 568,994 registration records. The fields were checked to make certain all general 2024 election results were in the proper field (this year they were – another improvement). At this point, we had a data file for analysis.
Original fields allow data to be separated by county and precinct. These generate fields for national and statewide offices, and local election districts. Age, sex, and political affiliation (if any) are also recorded. In areas where political parties organize on the basis of neighborhood groups, a field can be inserted to identify these if they are defined in terms of groups of precincts.
The graph below shows the number of registered voters and the number of votes cast by sex and party as percentages of total registrations and votes for Iowa’s 3rd Congressional District.
Similar representations can be made by age group, sex by age group, or age group by sex. Any of these can be done statewide or by
Congressional district
Any state legislative district
County
Precinct
Any other jurisdiction that can be created with these groups
The graph below represents the same data splits as the graph above. This time, however, the area is Polk County. Polk is by far the most populous of the 21 counties that make up Iowa’s 3rd Congressional District. It accounts for approximately 61 percent of registered voters in the district and approximately 61 percent of district votes cast in the 2024 general election.
In both Polk County and the 3rd Congressional District, Democrats are dependent upon female voters and Republicans are dependent upon male voters. Both of these groups are significantly more likely to vote than any other groups depicted in the graphs.
Also apparent is the size of the independent group. In the 3rd Congressional District, Independents are the largest registered voter block. In Polk County, they are the second largest block. Independents do not turn out at the same rates as Republicans and Democrats, but the potential size of the block means it has significant impacts on elections.
We can take the voter results derived from the Iowa Voter Registration Database and blend them with candidate results from the Official Canvass by County and Precinct Results by County to get a pretty good estimate of the number of Independents who voted for candidates of either party. Without accounting for undervotes (registrants that voted in the election but did not vote in this contest) or overvotes (registrants that voted for too many candidates in this contest and, thus, had their votes voided), we can roughly estimate that 47.5% of voting Independents voted for the Democratic candidate for congress and 44.4% voted for the Republican candidate in the race for Iowa’s 3rd Congressional District seat. In Polk County, 51.2% voted for the Democratic candidate and 41.8% voted for the Republican candidate in the race. In neither area do the totals sum to 100%. Accounting for overvotes and undervotes (which could be done with available data) would push up all of these percentages. It is also nearly certain that some Independents (as well as some Republicans and Democrats) placed write-in votes for unlisted candidates.
This work is ongoing as inquiries for election analysis come in. Regional Strategic, Ltd. has the data in-house to work on 2024 general election results for Iowa. Data for other states can be obtained. Analysis is possible by age, sex, political affiliation and region to the extent that any individual state’s database will support.
We all get our best results if we stick to things we are good at and interested in, but every enterprise involves a lot of tasks that don’t fit into any team member’s, “Voodoo set.”
Many economic development staff, business entrepreneurs, and community advocates are vision people. They must be to keep teams of volunteers, employees, and stakeholders together, focused on the goal, and moving forward.
It takes a lot of marketing, a good bit of dreaming, and a whole bunch of optimism.
That doesn’t leave a lot of time for analysis – whether that is the quantitative analysis of hard data or the qualitative analysis of personal feedback, surveys, and community discussions.
A lot of this very important stuff gets done at the frustration level. That is a recipe for lost opportunities.
Regional Strategic, Ltd. specializes in the analysis of data and community input. We can help you build a solid foundation under your vision. We are data experts. We are stakeholder input experts.
We are doing some market analysis in Texas and surrounding states. One of the issues is to identify populations that might be potential purchasers of a particular offering. That is at least partially a function of income.
The graph below shows estimates of real per capita income trends within Texas household income quintiles.
For this graph, we didn’t work with any of the detailed categories. We stuck with total personal income.
Data came in a zip file with data for every state from 2012 to 2022. There were separate workbooks for every state. For every state there were separate worksheets for every year. Job one was to extract the data and combine all the years for Texas.
The downloaded data was not adjusted for inflation. We could easily see that some quintiles had seen income growth. With others, however, we could not immediately see if that was growth or if that was inflation. Step two was to download Consumer Price Index (CPI) data and adjust all of the years and quintile values to 2022-equivalent dollars. CPI data is available for download at https://www.bls.gov/cpi/data.htm. We used data for all urban consumers in the Southern region of the U.S. We used annual measurements that were not seasonally adjusted.
With inflation-adjusted data for quintiles of Texas households, we still could not see if individuals were gaining or losing ground. This is because every year the quintiles each give data for one-fifth of the households, but we have no idea of household or population growth.
We made a simple assumption that households averaged the same size across all five quintiles. That allowed us to take annual Texas population estimates divided by five as the number of people in each quintile. Dividing inflation-adjusted quintile incomes by population gave us the per capita income estimates shown in the graph. We utilized Texas population estimates from the BEA at https://www.bea.gov/data/by-place-states-territories, because data from the BEA is remarkably easy to locate, download, and use.
There are a few things about the data and the data manipulation that deserve note.
First, for every year the total income received by the top quintile was greater than the income received by the bottom four quintiles combined. This was not changed by any of the manipulations described above.
Second, the assumption that household sizes are the same across all quintiles was convenient and gave us the ability to normalize the data for population size but is probably not completely accurate. For any quintile where household sizes are larger than the overall average, the quintile’s per capita estimate would shift down. Conversely, for any quintile where households are smaller than the overall average, the quintile’s per capita estimate would shift up.
Our best guess is that the lower quintiles have larger households and that the higher quintiles have smaller households. This is consistent with the demographic arguments in the recent post, “The Coming Depopulation.” If so, the lines for the bottom quintiles would drop and the lines for the top quintiles would rise.
Third, the data estimates current realized income. That is pretty close to total income for the bottom quintiles. Households in the upper quintiles, however, are likely to have significant levels of unrealized unearned incomes in the form of appreciation or capital gains on investments. These streams are reported and show up in the data as they are realized. If they are realized in a constant steady stream over time, the data is probably an accurate reflection of reality. To the extent that unrealized income streams are growing over time, the data will underestimate them during any period.
This was an interesting exercise undertaken as part of a larger analysis of market potential in the Southern U.S. It is possible to replicate this for any state and to engage the data at a more specific level. While multistate regions can also be analyzed, they require additional manipulation because income ranges on household quintiles will be unique to every state. In all cases, a careful disclosure of assumptions made and the potential implications of those assumptions is required.