Skip to Content
  Contact Us

Notes from Regional Strategic, Ltd.

Politics, Real and Perceived Commodity Prices, and Their Effects upon Farm and Non-farm Incomes in Iowa

Over the past several weeks, I have heard multiple farmers say that, while prices are really bad right now, they are still a buck or two higher than when Biden was president. I didn’t believe them for a minute, but, at the same time, I don’t believe they were lying to me.

Our minds all work to make sense out of the thousands of bits of information we encounter each day. We unconsciously build a story that makes consistent sense of our current experiences and our deeply held beliefs. As a result, we all firmly believe some things that are somewhat less than true. We truly believe them because they are consistent with our understanding of ourselves. If you care to delve into this phenomenon, I suggest picking up a copy of Daniel Kahneman’s Thinking, Fast and Slow.

Anyway, while these gentlemen were not lying, they were passing on untruths. It is likely that presenting facts in response will have no effect upon what they believe, but facts are available, and I am going to run through a few of them here.

This is about more than prices for a bushel of corn or soybeans. A buck or two on Iowa’s 2.7 billion bushels of corn and 600 million bushels of soybeans is 3.3 to 6.6 billion dollars, or 2-3 percent of Iowa’s personal income. The gain or loss of a buck or two on a bushel of corn or soybeans is important to the state’s economy as a whole.

As farmers spend or don’t spend this level of money, revenues surge or dry up for local car dealers, dance instructors, restaurants, and grocers. This determines whether kids wear new shoes to school – farm kids and non-farm kids alike. Voting on the basis of falsely held beliefs regarding commodity prices affects the entire community – not just the farmer. The discussion that follows attempts to put some values on these impacts for Iowa.

USDA Market Year Prices

We start with market year average prices from the United States Department of Agriculture (USDA). Market years run from September 1 of the harvest year to August 31 of the following year. They coincide with the expected period during which a producer markets the current harvest.

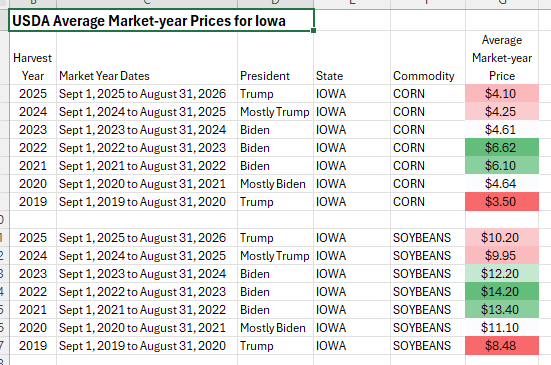
The table below shows USDA average market year prices for corn and soybeans from the 2019 harvest year to the 2025 harvest year in Iowa. The table includes market year dates for reference. It also indicates who was president during the market year. The lists of market year prices for both corn and soybeans were given a color-gradient scale with Excel. Red indicates the lowest prices. Green indicates the highest prices. All of the red occurs in Trump presidencies. All of the green occurs during the Biden presidency.

The price range for corn over the seven market years is from $3.50 per bushel to $6.62 per bushel. The range for soybeans is from $8.48 per bushel to $14.20 per bushel.
Adjusting for Inflation, Adding Production Levels, and Generating a Weighted Average Inflation Adjusted Price for the Period

The discussion above is sufficient, in and of itself, to address the price comments we have heard from farmers. These differences, however, have significant effects on Iowa’s non-farm economy. To show that, we need to demonstrate the effect that these price swings have on the overall income – farm and non-farm.

Inflation Adjustment

We start by adjusting the market year prices for inflation. At a per-bushel level over seven years this is not hugely important. If we are to look at overall income, however, we have to multiply per-bushel prices by total production. A ten-cent price difference multiplied times 2.5 billion bushels of corn is 250 million dollars. To avoid this variance, we used the Consumer Price Index (CPI) for all Midwestern urban consumers to standardize dollar values across the period.

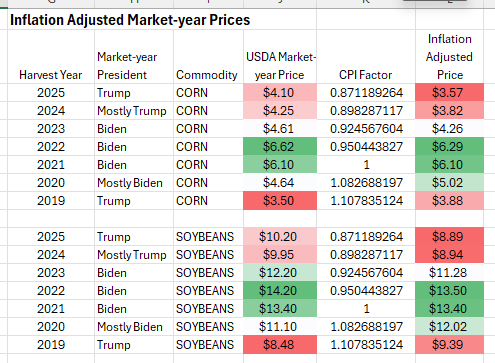
We made the assumption that USDA market year prices were representative of prices at the midpoint of the market year. We then averaged CPI indices for February and March of the years 2020 to 2026 to coincide with the midpoints of the 2019 to 2025 market years. We then used those averages to standardize our USDA market year prices on the dollar value at the midpoint of 2021 market year (February-March of 2022). The year was chosen because it matches the current set-up of the economic impact model we will be using below. It has no effect on results.

Inflation adjusted prices are shown in the table below. Once again, the prices were placed on a color-gradient scale.
Adding Production, Realized Income, and a Weighted Average Price

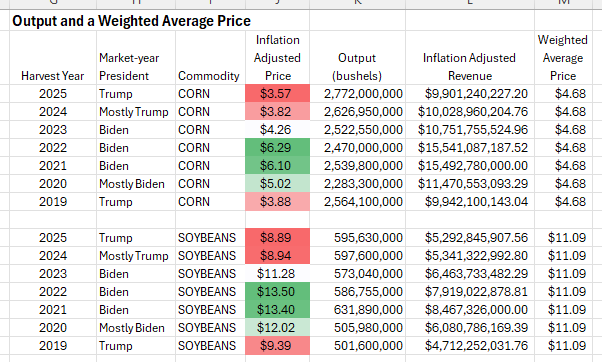
To get to total incomes related to the price variations we see, we add bushel output for both corn and soybeans through the period. Output numbers are from the USDA and represent the harvest years coinciding with the market year prices utilized above.

To generate income or realized revenue, we simply multiplied inflation adjusted prices times output levels to get inflation adjusted revenue for each crop year.

Then we divided the sum of inflation adjusted revenue by the sum of output across the seven years to generate a weighted average price for the overall period. Our weighted average price for corn is $4.68 per bushel. For soybeans, $11.09 per bushel. Both weighted average prices are denominated in dollar values current at February-March 2022.
The Difference Between Realized Revenue and Baseline Revenue

We used realized income in the table above to generate a weighted average price for both corn and soybeans across the seven-year period. The weighted average price can be used as a baseline of sorts to reflect expectations. We can multiply the weighted average price times annual production values to get a baseline revenue value or expected revenue relative to any year’s production volume.

We can then subtract our calculated value of baseline revenue from our calculate value of actual inflation adjusted revenue to generate a measure of realized farm revenue divergence.

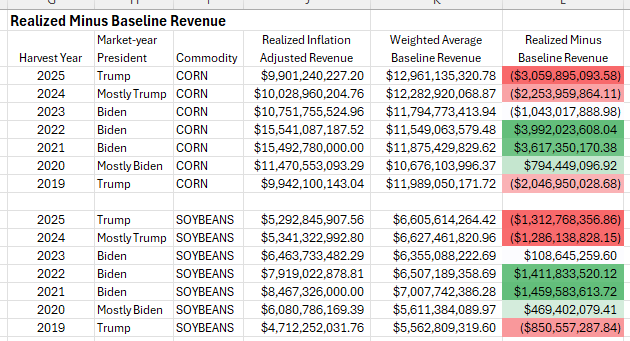
We have done that in the table below. We have used Excel to place a color gradient on the series. Red represents a large negative divergence (expectations are much higher than realizations). Green represents large positive divergence (expectations are much lower than realizations).

For corn, our divergences of realized to expected revenues ran from a deficit of over $3 billion to a surplus of nearly $4 billion – a spread of nearly $7 billion.

For soybeans, our divergences of realized to expected revenues ran from a deficit of $1.3 billion to a surplus of nearly $1.5 billion – a spread of nearly $2.8 billion.

These variations all represent farm income. At this point, we have made no assumptions or estimates on how these farm income fluctuations will affect the surrounding non-farm economy. They will have an effect, however. When farm incomes are flush, farmers spend extra money on new vehicles, recreation, goods, and services. When farm incomes are short, farmers economize on these expenditures.
Non-farm Impacts of Farm Revenue Variations

Because we are working only with final price variations and production is fixed, we can look at this variation in farm revenue as variations in farm family income. By the time commodity prices are established, all farm production activities and expenses have been realized. The economic impact of production is fixed. The economic impact of these income variations are entirely due to changes in the expenditures of farm families in the economy around them.

To get at this, we first combined the corn and soybean variations for every year (the far-right column of numbers in the table above). Then we ran these summed variations in farm income for every year through an economic impact model generated with Regional Input-Output Multiplier System coefficients from the U.S. Bureau of Economic Analysis (BEA). We then used the CPI to adjust the dollar values to reflect dollar values at the midpoint of the 2025 market year (February-March 2026) to bring the values into line with current price experience.

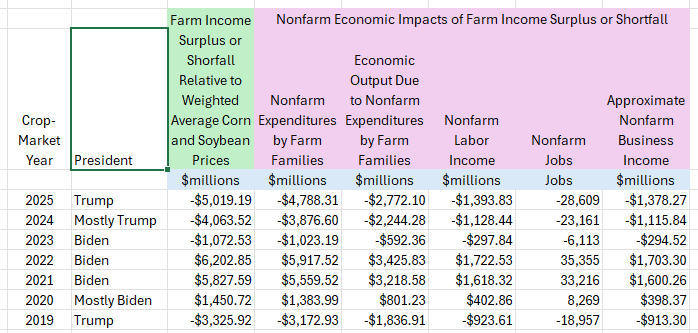
The results of this are shown in the table below. The first column of numbers (under the green-shaded heading) is the sum of the corn and soybean income variations from the table above after adjusting to February-March 2026 dollar values. This is the effect that revenue surpluses or deficits from our weighted average price directly affect farm families in Iowa. In the 2025 line, this figure reflects a shortfall of slightly over $5 billion in Iowa farm income relative to expectations based on our weighted average prices for corn and soybeans.

The next five columns (under the plum-shaded headings) show the off-farm impact of these farm income variations. The first of these columns shows changes in non-farm expenditures by farm families. In the 2025 row, for example, we see that a farm income shortfall of just over $5 billion is expected to result in a nearly $4.8 billion reduction in farm family expenditures. This is money that is not received by businesses like auto dealers, grocers, dance studios, and restaurants around Iowa.

Of this $4.8 billion that Iowa businesses do not receive from farm families, nearly $2.8 billion is value that would have been created within the Iowa economy – “Value Added” in the language of economists. The remaining $2 billion would have consisted of goods and services imported from outside of Iowa.

The $2.8 billion in lost Iowa economic activbity would be split nearly evenly between labor income ($1.39 billion that would have supported over 28,000 jobs) and business income ($1.38 billion worth of business earnings, interests, rents, and a very small sliver of indirect business taxes).

You can run across any of the crop-market year lines and build a similar story. The column with the green-shaded heading represents the direct effect of expected price shortfalls on farm income. The columns with the plum-shaded headings shows how reduced farm income translates into reduced off-farm expenditures, payrolls, jobs, and business income.

Conclusion

This all started with a few farmers remarking that farm prices, while bad, are a couple of dollars higher than they were under President Biden. Even though it is easy to demonstrate that they are wrong, these farmers are sincere in their beliefs in this regard.

As a talking point, a couple of dollars on a bushel of corn or soybeans passes most of us without generating an awareness of billions of dollars in lost economic activity. This is unfortunate.

When we can promote simple erroneous statements as political talking points and ignore the fact that those erroneous statements mask billion-dollar swings in personal income and economic activity, we are encouraging people to vote in ways that are in direct opposition to their own self interests and the interests of their neighbors.

Nothing is more detrimental to faith in government than false political narratives that are demonstrably harmful to the very people they are targeted at.

Day 20: Dollar Values of the Shutdown in Iowa

It is Monday morning. We are in the 20th day of the federal government shutdown. One of the things that most strikes me is the complete lack of information from politicians and officials on both sides of the aisle about how much money is at stake, and what the impacts of stopping those flows of money might be.

We hear who’s fault it is, but we don’t hear about what it really is. No one wants to talk about the problem. No one wants to talk about the repercussions. Everyone is obsessed with the blame.

Today, we are looking at the broad sweep of federal transfers to the Iowa economy. It is only one state, but it is instructive.

A Reasonable Minimum

Common Good Iowa maintains a compilation of federal funding transfers to Iowa governments and nonprofit organizations. In 2024, it totaled $8.58 BILLION, or $23.5 million per day. It is a big number, but given the complexity of intergovernmental finance, it is almost certainly incomplete. Let’s look at it as a reasonable minimum.

This Includes

This includes Medicaid funding, which was heavily cut prior to the shutdown. It includes about $2 million per day for education funding, which the president has directly targeted with layoffs and terminations since the shutdown started.

It also includes nearly a billion dollars for transportation. Most of this goes into highway construction and repair. How many of those barricades you have been detouring around will still be there next year because of the shutdown? A lot of them.

This Does Not Include

It does not include direct payments to individuals or farms or trust fund payments for Medicare. Social Security, farm payments, and Medicare payments to Iowa in 2024 were triple the total in the Common Good Iowa compilation, at $26.20 BILLION, or $67.4 million per day.

It does not include veterans’ benefits from the Veterans Administration or operating costs for Veterans Administration facilities. It also does not include several smaller federal pension funds’ distributions in Iowa. These total $2.73 BILLION per year.

This also does not include Department of Defense funding for military installations around Iowa and civilian and military employees of the department. Total defense contract, grant, and payroll spending in Iowa in 2023 was $3.4 BILLION.

It does not include Department of Energy direct contracts and grants to businesses and department operational costs of $80.26 million.

It does not include direct grants and loans to students of $1.35 BILLION from the Department of Education.

Finally, it does not include direct federal contract and grant expenditures to Iowa business entities by federal departments other than the Department of Defense, the Department of Energy, and the Veterans Administration. There are almost certainly several BILLION dollars more that we have not captured here. Every BILLION not accounted for would equate to another $2.74 million in federal inflows per day.

Summing Up the Whole Ball of Wax

So, between the direct infusions to state and local governments and nonprofit organizations, Medicare, defense expenditures, and direct payments to individuals and farms that we could account for, the federal government pours about $42.34 BILLION into Iowa per year. That averages $116 million per day. We are certain there are several more BILLIONS of dollars we have not been able to account for.

Most direct payments to governments, nonprofits, and farms will not be made during the federal shutdown. Most federal payroll will not be paid during the shutdown. Direct payments from the Social Security and Medicare trust funds, while they don’t directly affect the budget, will be available entirely at the discretion of the president, who has made no secret of wanting to shut both programs down.

The Larger Impact

In addition to the hardships that will be imposed upon the direct individual and business recipients when these funds are cut off, THIS WILL ALSO IMPACT OTHER IOWANS whose incomes depend on the direct recipients cutting payroll checks, ordering supplies, letting construction contracts, or buying groceries, utilizing health care, and purchasing other goods and services.

The most conservative way to model the impact of this is to assume these funds all go directly into household incomes, so that is what we will do here. Every time we remove $116 million in household income from the Iowa economy, we should expect a loss of 710 jobs and $32.9 million in lost business incomes (profits, rents, and interest). If we remove $116 million every day, we should expect to lose 710 jobs and $32.9 million in business income every day.

That is a conservative estimate of the average Iowa cost of every day of a total federal shutdown. It won’t happen all at once. The federal government has not stopped all transfers, but every day that the shutdown continues the remaining transfers will increasingly be subject to presidential whim. While private closures and layoffs tend to lag as businesses struggle to survive, eventually the loss of cash flows will be overwhelming.

The longer the shutdown goes on, the closer we will come to these daily average total impacts.

This is doubly true as the federal government continues to extract taxes from Iowans as it strangles the flow of funds back to Iowa.

Impact on the State Budget

There is also the state budget. In FY2024, Iowa collected about 5.8 cents in revenue for every dollar of personal income its residents received. The average potential loss of 710 jobs per day during the shutdown carries an expected average payroll loss of $33.23 million for every day the shutdown goes on. Losing that payroll will deprive the Iowa treasury of about $1.93 million in revenue for every day that the shutdown continues. This in a state that is already living with a budget deficit.

Finally, Iowa Is a Recipient State

Iowa is a recipient state. Iowa receives substantially more from the federal government than it contributes in federal taxes and fees. In 2023, Iowa received $1.28 in federal expenditures for every $1.00 Iowa contributed in federal taxes and fees. That is equivalent to Iowa making a 28% profit on its federal taxes!

Whenever the federal government starts cutting across-the-board, Iowa suffers disproportionately, because the net positive federal funding stream is incredibly favorable to Iowa.

In 2023, only 6 states contributed more to the federal government than they received. All 6 are blue states. Another 4 states came within a nickel of breaking even. Three of the 4 were blue states.

Sources

This information was generated using data available from Common Good Iowa, the Environmental Working Group, the Rockefeller Institute of Government, the Bureau of Economic Analysis, the Bureau of Labor Statistics, the Office of Local Defense Community Cooperation, the Department of Energy, the Department of Education, the Veterans Administration, and the Social Security Administration.

The Federal Shutdown and Iowa

It’s October 3, 2025, and the federal government shut down two days ago for lack of budget legislation. It was not a surprise. Republicans holding power in the House of Representatives, the Senate, and the White House have made it a point not to negotiate a resolution, either among themselves (they had the power to resolve this all by themselves) or with the opposition party.

Citizens in the United States are becoming so used to dysfunctional federal government that the whole affair was met with a collective yawn on October 1. The pain will not hit immediately, and, when it does, most citizens believe it will not fall directly upon themselves.

Citizens in the United States have become so self-indulgent that pain which does not fall directly upon themselves does not matter.

In that context, all the follows may be a waste of time and computational effort. What follows is a quick look at the ongoing costs of a federal government shutdown on the state of Iowa. Iowa was picked because I am familiar with the data and I have a recently constructed economic impact model for Iowa. Similar calculations could certainly be done for any state.

The analysis will be done on the basis of a one-day shutdown. Results can be multiplied by the number of days the shutdown lasts to approximate total costs to the Iowa economy. Wherever possible, I will try to bring effects back to numbers of jobs lost.

To put this in perspective, over the past ten years, from December 2014 to December 2024, Iowa had a net gain of just 10 nonfarm jobs per day. Over the past year, from December 2023 to December 2024, Iowa had a net loss of 15.5 nonfarm jobs per day.

Federal Jobs

The first loss Iowa will see from a shutdown is the idling of federal employees. Iowa has about 18,400 federal civilian employees (Bureau of Labor Statistics – BLS). Most of them will be idled as nonessential workers. These employees generate an Iowa payroll of a little over $524,000 per workday (Bureau of Economic Analysis (BEA) and BLS). Like the rest of us, they spend their earnings on groceries, cars, clothes, dance lessons, and what-not.

When that payroll money does not get spent, someone else in Iowa doesn’t receive it. In general, taking half a million dollars out of Iowa payrolls will result in a loss of about 3.5 jobs. That means Iowa can expect to lose 3.5 jobs for every day the shutdown lasts. This is in addition to the 18,400 federal workers idled by the shutdown. This is a loss to the rest of us because those federal workers are not being paid and are not spending their earnings in the local economy.

Remember, over the past ten years, Iowa has generated only ten new nonfarm jobs per day.

Finally, this is not just workers. Idling federal workers will cost Iowa nearly $150,000 in business earnings (profits, rents, interest, etc.) for every day the shutdown continues. This is entirely from the effects of the unspent federal payrolls. This does not include the losses of federal contract or supply receipts or federal direct payments.

Direct Farm Payments

According to the Environmental Working Group, Iowa farmers received $43.5 billion dollars in direct payments over the past 30 years. This works out to an average of nearly $4 million per day, ever day, over the period. Because crops have already been cultivated this year, this is also best looked at as a subtraction from farm family incomes.

If we remove these sums from farm family incomes, farm families, like the federal employees above, will not be able to spend their funds on cars, houses, groceries, and what-not. This drop in expenditures means other Iowa families will not receive these expenditures as income.

The result of all of this is that reducing farm family expenditures by $4 million will reduce Iowa’s total employment by 26 jobs. It will reduce Iowa business earnings by $1.1 million.

On average, this will happen every day of the shutdown. The model is linear. The results can be multiplied by the number of days the shutdown lasts.

Remember, this will be in addition to the initial $4 million daily loss in farm family income.

Social Security Benefits

According to the BEA, Iowans received $15.5 billion in Social Security payments during 2024. This works out to an average of $42.5 million per day. This, too, is an addition to family income. When it does not arrive, recipients do not spend it on groceries, medical care, vacations, cars, and what-not. This reduces the incomes of Iowans who would normally supply these things to the recipients.

Reducing Iowa household income by the loss of daily potential Social Security payments would cost Iowa 278 jobs for every day that a shutdown stops Social Security payments. It would also cost Iowa businesses $11.7 million in lost earnings – every day that Social Security payments are not received. This is on top of and completely separate from the hardships imposed on Social Security recipients.

Medicare and Medicaid

The BEA reports that Medicare and Medicaid pumped $19.5 billion into the Iowa healthcare industry in 2024. This averages $53.2 million per day.

Unlike the impacts calculated above, these sums are not properly looked upon as changes to household income. Medicare and Medicaid payments are direct purchases of services from the healthcare industry.

Splitting these expenditures across the segments of the healthcare industry in Iowa results in a loss of 612 jobs for every day’s loss in Medicare and Medicaid expenditures in Iowa. It also results in the lose of approximately $21.7 million in business earnings across the state.

These estimates can be multiplied over the days payments are eliminated during a government shutdown.

These estimates are above and beyond the hardships imposed on recipients who are denied healthcare, and they are above and beyond additional costs that result from healthcare being denied.

Roll It All Together

Summing up the impacts laid out above, each day’s loss of the federal funding would cost 920 jobs and $34.6 million in business earnings. This would be above and beyond the direct loss of incomes and services to the initial recipients of the funds.

This would be multiplied every day receipts and services are lost due to a federal government shutdown.

Unlike a layoff at John Deere or some other manufacturer, however, these losses will be spread across businesses throughout Iowa and will not be reported to the Iowa Department of Workforce Development as mass layoffs. They will not be reported in the media the same way a mass layoff would be reported.

It will start as reduced hours, lost shifts, and scattered individual job losses, but the steady march of reduced expenditures, incomes, and employment will be insidious. The victims will be largely invisible except to their own small circles of family and friends.

And On and On and On We Go

Without going on ad nauseum, this is not all of it. According to Common Good Iowa, in 2024

  • The USDA spent $916.6 million in Iowa beyond direct farm payments  
  • The Department of Commerce spent $1.4 million 
  • The Department of Education spent $676 million 
  • The Department of Energy spent $7.6 million 
  • The Environmental Protection Agency spent $139.1 million 
  • The Department of Health and Human Services spent $795.4 million in addition to its Medicaid outlays 
  • Homeland Security spent $11 million 
  • Housing and Urban Development spent $77.2 million 
  • The Department of the Interior spent $30.5 million 
  • The Justice Department spent $17.3 million 
  • The Department of Labor spent $60.2 million 
  • The National Endowment for the Arts and Humanities spent $1.9 million 
  • The Department of Transportation spent $934.6 million

It all totals another $3.77 billion in federal spending in Iowa – an average of over $10 million per day. All of this could also be allocated to industries and run through an economic impact model, but you get the idea.

Most of us won’t directly feel the effects of a federal shutdown unless it lingers for some time. Although scattered, however, those impacts are larger on a daily average basis than the largest mass layoff reports that regularly make headlines in Iowa.

The invisibility of the victims magnifies the cruelty of these impacts and the irresponsibility of the people who made the shutdown a reality.

Terminating Federal Funding Flows – An Iowa Example

Increasingly, we live in a world where the federal funding we have integrated into our local economies cannot be relied upon. At the same time, there are no guarantees that the lost funds will be returned to the economy in other forms if they are removed. There is substantial talk of deficit reduction and of selective tax cuts, but there is no sign that funds held at the federal level will be broadly distributed to the local economies which will bear the loss.

This is a simple analysis of what the Iowa economy would look like if four major flows of federal funding were cut off:

  • Agricultural Subsidies
  • Social Security
  • Medicare
  • Medicaid (the federal share only)

No assumptions are made of any alternative flows that would replace these losses. This is simply a look at general expectations assuming these funding flows simply disappear.

Data for this exercise were collected for 2023. This is the last year for which the full range of data could be obtained. All data except the level of agricultural subsidies was sourced from the United States Bureau of Economic Analysis (BEA). Agricultural subsidy totals were obtained from the Environmental Working Group, because the BEA has recently stopped publishing detailed agricultural industry statistics at the local level.

The effects of removing each of the four funding flows were analyzed using an impact model built with Iowa economic coefficients obtained from the BEA Regional Input-output Modeling System (RIMS II). Each of the four major funding sources was run separately, sums were taken, and a comparison was made to Iowa totals for actual 2023 gross domestic product and employment. The table below shows the results. Dollar values are in billions.

What all falls out is a loss in federal funding of almost $30 billion. As these losses percolate through the Iowa economy, they will result in

  • Lost economic transactions totaling $42 billion
  • Lost economic value added (GDP) totaling $24 billion
  • Lost business income, interest payments, rents, and direct production taxes of $10 billion
  • Lost labor income (payrolls) of nearly $14 billion
  • Over 268,000 jobs lost

At the end of the day, Iowa can expect to see its GDP drop by almost 12 percent and its employment totals to drop by 12.5 percent if these funding flows are terminated without replacement. Iowa is not unique among states with respect to the expected impacts if major federal funding streams dry up.

Additionally, we can use payrolls as a proxy for production and income to roughly estimate Iowa tax losses resulting from this. Iowa collects approximately 8.75 cents in general revenue for every dollar in statewide payroll. At this rate, the loss of payrolls resulting from losing federal flows of funds would result in a reduction of state general tax revenue by over $1.2 billion. This would further cut expenditures throughout the state and magnify the losses listed above.

Regardless of the pros and cons of government interventions in the economy, the economy has been built up over decades on the incentive systems driven by those interventions. It would behoove us all to be a patient and cautious in making changes.

SF 615: An Impact Model Based Policy Analysis

The Iowa Legislature is currently working on a bill (SF 615) to impose work requirements on able bodied adult recipients of Medicaid. The bill passed the senate on Tuesday, March 27. It was passed with amendments by the house on Wednesday, March 28, and sent back to the senate. It will likely be passed and signed into law during the week of March 31, 2025.

On the face of it, it is kind of hard to figure out what this means. The governor apparently put forth the bill, but neither the governor’s office nor the departments of health & human services, public health, revenue, or management & budget provided any information to the Legislative Service Bureau on costs, savings, or fiscal implications of the bill.

Either they don’t know, don’t care to know, or don’t want anyone else to know the implications of SF 615. One can easily find estimates on the internet that 75 percent of Iowa adults on Medicaid already work, but it is hard to determine the potential exemption status of the other 25 percent.

To its credit, the Legislative Service Bureau did provide some important estimates to underpin the analysis presented here:

  • The bill will generate Medicaid savings of $3.1 million to the State of Iowa in the first year
  • The bill will generate savings of $17.5 million in the second and subsequent years
  • The funding percentage split between federal and state is 88.4 percent federal and 11.6 percent state

This means that when the state saves $3.1 million in the first year, the federal government will save $23.6 million, and when Iowa saves $17.5 million the second year, the federal government will save $133.4 million. Summing these up, during the first year while the State of Iowa is saving $3.1 million it will be cutting health care expenditures in the state by $26.7 million. During the second year the state will save $17.5 million by cutting statewide health care expenditures by $150.9 million.

So far, this has all been derived directly from the estimates made by the Legislative Service Bureau.

The United States Bureau of Economic Analysis (BEA) generates estimates of expenditures for each state. Assuming the healthcare expenditures eliminated by SF 615 are spread through the system on an equivalent basis to Iowa’s overall health expenditures, they can be run through an input-output model to see how they will affect the entire Iowa economy. The model was set up using coefficients available from the BEA.

Four scenarios were set up – two each for first year and for second year reductions in health care expenditures. In the first scenario for each year, health care expenditures were cut, and no other changes were made. In the second scenario for each year, it was assumed that the State of Iowa’s estimated savings were concurrently returned to taxpayers as household income (equivalent tax cut scenarios spread proportionately to income distributions).

Scenario One: First year health care expenditure cuts without equivalent tax reductions

  • State of Iowa savings – $3.1 million
  • Health care expenditure cuts – $26.7 million
  • Statewide payroll reductions – $17.3 million
  • Statewide jobs reduction – 307 jobs
  • Reduction in statewide returns to capital (profits, interest, rents, etc.) – $10.9 million

Job losses will fall predominantly in these sectors:

  • Health care – 189
  • Finance & real estate – 28
  • Professional, management, & administrative – 23
  • Wholesale & retail trade – 21

Additionally, a very rough estimate of state general revenue fund tax loss can be made by dividing state net tax deposits (Iowa Department of Revenue) by earnings by place of work (BEA) for Iowa. That calculation results in 8.75 cents in general fund tax deposits per dollar of payroll in the state.

This estimated tax loss would be $1.5 million. It would not include losses in non-general state income, such as the lottery or liquor, and it does not include local government receipts, but it would still amount to approximately half of the state’s anticipated savings from restricting access to Medicaid.

Scenario Two: First year health expenditure cuts with equivalent general tax reductions

  • State of Iowa savings – $0 (all savings are distributed in an equivalent tax cut)
  • Health care expenditure cuts – $26.7 million
  • Statewide payroll reductions – $16.4 million
  • Statewide jobs reduction – 287 jobs
  • Reduction in statewide returns to capital (profits, interest, rents, etc.) – $10.0 million
  • Estimated general revenue tax losses – $1.4 million

Job losses will fall predominantly in these sectors:

  • Health care – 185
  • Finance & real estate – 24
  • Professional, management, & administrative – 21
  • Wholesale & retail trade – 17

Scenario Three: Second year health expenditure cuts without equivalent tax reductions

  • State of Iowa savings – $17.5 million
  • Health care expenditure cuts – $150.9 million
  • Statewide payroll reductions – $97.7 million
  • Statewide jobs reduction – 1735 jobs
  • Reduction in statewide returns to capital (profits, interest, rents, etc.) – $61.5 million
  • Estimated general revenue tax losses – $8.5 million

Job losses will fall predominantly in these sectors:

  • Health care – 1068
  • Finance & real estate – 155
  • Professional, management, & administrative – 128
  • Wholesale & retail trade – 119
  • Manufacturing – 38

Scenario Four: Second year health expenditure cuts with equivalent general tax reductions

  • State of Iowa savings – $0 (all savings are distributed in an equivalent tax cut)
  • Health care expenditure cuts – $150.9 million
  • Statewide payroll reductions – $92.9 million
  • Statewide jobs reduction – 1620 jobs
  • Reduction in statewide returns to capital (profits, interest, rents, etc.) – $56.7 million
  • Estimated general revenue tax losses – $8.1 million

Job losses will fall predominantly in these sectors:

  • Health care – 1047
  • Finance & real estate – 134
  • Professional, management, & administrative – 121
  • Wholesale & retail trade – 95
  • Manufacturing – 33

Some thoughts

Regardless of the merits of imposing work requirements where the great majority are already working (recall that the governor and affected state departments declined to provide details regarding those merits), this is not simply a state budget reduction effort. It will significantly affect payrolls, employment, profits, and tax receipts across the state.

These effects are magnified by the fact that the federal government multiplies Iowa’s investment. For every dollar the state puts into these benefits the federal government contributes $7.62. That means that for every dollar the state saves with SF 615, the state forgoes $8.62 in economic activity that generates payrolls, employment, profits, and tax revenue. The state savings of $17.5 million per year will cost the state’s economy almost $151 million in expenditures (economic activity) per year.

The magnitude of these losses, particularly in the health care industry, will force providers to abandon billions of dollars worth of investments in facilities and infrastructure. These abandonments will not magically reappear if SF 615 is subsequently modified or repealed.

It should also be noted that, as expenditures fall, payrolls are cut, profits disappear, and jobs are axed it will be harder for Medicaid recipients to find the required jobs. This will remove more of them from Medicaid. This will save the state more money. For every dollar saved in this manner, another $8.62 in health care expenditures will be removed from the economy and the cycle of disruption to the state’s economy will continue to expand.

These are a costs that deserve more analysis than the governor or the statehouse has given.

Attempting to Offset Program Cuts with Equivalent Reductions in Taxes

I have recently posted three analyses of the Iowa economic impacts of breaking Social Security, Medicare, and Medicaid (Privatizing Social Security, Social Security – a Local (Iowa) Perspective, and Breaking Medicare and Medicaid – An Economic Perspective from Iowa).

None of these dealt directly with the typical small-government argument that an offsetting reduction in taxes will eliminate the adverse effects of eliminating programs.

This argument is not actually true in most cases. The reason is that markets are not neutral. They are created within the context of government intervention, and government intervention is required for efficient markets to function over time. Government defines and enforces property rights. Government oversees the accessibility and stability of the money supply. Government regulates financial transactions. Government influences marginal propensities to spend resources on and between categories of goods and services through taxation, investment, and program regulations and expenditures.

For better or for worse (I am not arguing one way or another), these influences shape markets, private investments, employment, and income. Making substantial changes to the way government influences the shape of markets and the economy will generally cause significant disruptions in the system. Those disruptions generally do not even out among all participants.

This analysis looks at the effects of eliminating federal Medicare and Medicaid benefits in Iowa and replacing them with equivalent increases in household income through tax reductions (see, in particular, Breaking Medicare and Medicaid – An Economic Perspective from Iowa). To develop this perspective, I

  • Set up a model of the Iowa economy
  • Removed $14.3 billion from the specific industry groups Medicare and Medicaid funding flow into
  • Added $14.3 billion to general household income

By both removing and adding $14.3 billion from/to the Iowa economy, the net initial impact on available resources is zero. The difference between where resources are removed and where resources are added, however, still results in devastating impacts upon the Iowa economy.

The change in how this $14.3 billion is allocated in the existing economic structure will result in a statewide payroll reduction of $5.6 billion reflected in the loss of over 70,000 jobs. Not all industries would lose jobs however:

  • Finance and real estate would see an increase of over 2,000 jobs
  • Wholesale and retail trade would see an increase of over 7,000 jobs
  • Education and the arts would see an increase of over 3,000 jobs
  • Accommodation and food service would see an increase in almost 2,000 jobs

On the other side of the coin

  • Health care would lose over 80,000 jobs
  • Professional services, management, and administration would lose over 7,000 jobs

These consequences would occur because markets are not neutral. They have been shaped for over 200 years by government interventions is property rights, taxation, expenditure, and regulation. An immediate and substantial change to the rules of the game can be expected to break down large segments of the economy that those rules have helped build up.

Regardless of philosophies regarding the long-term merits of one government-influenced market regime over another (and make no mistake, changes in government intervention only change the shape of government influence on the market – they do not eliminate that influence), it is important for the health of the economy that substantial changes be made slowly.

Furthermore, it is almost certain that the negative economic effects outlined above are understated. It will be worse than the results of the model shown above. It will be worse across all categories. Worse for the modeled winners as well as for the modeled losers. The reason is simple. The increases in household income (reductions in taxes) will not accrue to the same people who suffer losses of benefits.

In the model, the tax reductions were treated as increases to general personal income across Iowa. This assumes that tax reductions were proportional to incomes across the economy. That means that the people that lost Medicare and Medicaid benefits would be net losers in the transaction and everyone else would receive an unearned windfall.

A large proportion of this unearned windfall would go to high-income households with lower propensities to consume. This will result in a significant portion of the offsetting increases in income being removed from the economy as savings or financial investments. This would result in significantly lower offsetting economic activity than the model assumes. That, in turn, means the model results presented above are unrealistically optimistic.

In reality, however, this unearned windfall, these tax reductions, would not be spread proportionately across incomes within the economy. The current tax system and current proposed tax reforms heavily favor upper income households over lower income households (taxation policies are a major avenue through which government shapes the economy – see Why We Can’t Make Nice Things….). As a result, a predominant share (rather than the proportional share discussed in the previous two paragraphs) of offsetting personal income will accrue to upper income households. This will magnify the effect of lower marginal propensities to consume discussed in the paragraphs immediately above and further reduce the effect of offsetting income on benefit losses depicted in the model. For this reason, again, the economy-wide results modeled above are unrealistically over optimistic.

Regardless of the philosophical merits of any one form of government intervention over any other in shaping the economy, significant changes in these forms of intervention should not be made abruptly or haphazardly. The analysis above is clear that eliminating Medicare and Medicaid benefits in Iowa and replacing them with equivalent increases in household income through tax reductions will have a large negative impact on the Iowa economy. Markets are not neutral. They are shaped by the government. As a result, government has a responsibility to be responsible in changing the rules.

Interested in Learning More About Regional Strategic, Ltd.? Send Us a Message