Skip to Content
  Contact Us

Notes from Regional Strategic, Ltd.

Politics, Real and Perceived Commodity Prices, and Their Effects upon Farm and Non-farm Incomes in Iowa

Over the past several weeks, I have heard multiple farmers say that, while prices are really bad right now, they are still a buck or two higher than when Biden was president. I didn’t believe them for a minute, but, at the same time, I don’t believe they were lying to me.

Our minds all work to make sense out of the thousands of bits of information we encounter each day. We unconsciously build a story that makes consistent sense of our current experiences and our deeply held beliefs. As a result, we all firmly believe some things that are somewhat less than true. We truly believe them because they are consistent with our understanding of ourselves. If you care to delve into this phenomenon, I suggest picking up a copy of Daniel Kahneman’s Thinking, Fast and Slow.

Anyway, while these gentlemen were not lying, they were passing on untruths. It is likely that presenting facts in response will have no effect upon what they believe, but facts are available, and I am going to run through a few of them here.

This is about more than prices for a bushel of corn or soybeans. A buck or two on Iowa’s 2.7 billion bushels of corn and 600 million bushels of soybeans is 3.3 to 6.6 billion dollars, or 2-3 percent of Iowa’s personal income. The gain or loss of a buck or two on a bushel of corn or soybeans is important to the state’s economy as a whole.

As farmers spend or don’t spend this level of money, revenues surge or dry up for local car dealers, dance instructors, restaurants, and grocers. This determines whether kids wear new shoes to school – farm kids and non-farm kids alike. Voting on the basis of falsely held beliefs regarding commodity prices affects the entire community – not just the farmer. The discussion that follows attempts to put some values on these impacts for Iowa.

USDA Market Year Prices

We start with market year average prices from the United States Department of Agriculture (USDA). Market years run from September 1 of the harvest year to August 31 of the following year. They coincide with the expected period during which a producer markets the current harvest.

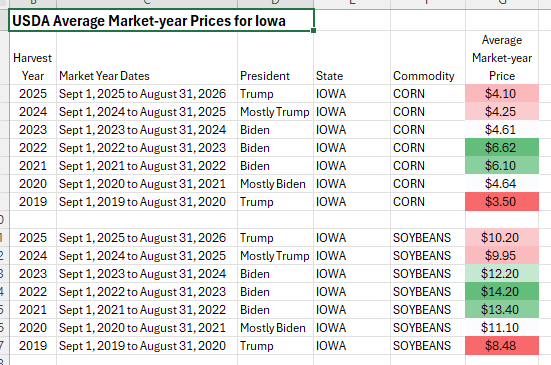
The table below shows USDA average market year prices for corn and soybeans from the 2019 harvest year to the 2025 harvest year in Iowa. The table includes market year dates for reference. It also indicates who was president during the market year. The lists of market year prices for both corn and soybeans were given a color-gradient scale with Excel. Red indicates the lowest prices. Green indicates the highest prices. All of the red occurs in Trump presidencies. All of the green occurs during the Biden presidency.

The price range for corn over the seven market years is from $3.50 per bushel to $6.62 per bushel. The range for soybeans is from $8.48 per bushel to $14.20 per bushel.
Adjusting for Inflation, Adding Production Levels, and Generating a Weighted Average Inflation Adjusted Price for the Period

The discussion above is sufficient, in and of itself, to address the price comments we have heard from farmers. These differences, however, have significant effects on Iowa’s non-farm economy. To show that, we need to demonstrate the effect that these price swings have on the overall income – farm and non-farm.

Inflation Adjustment

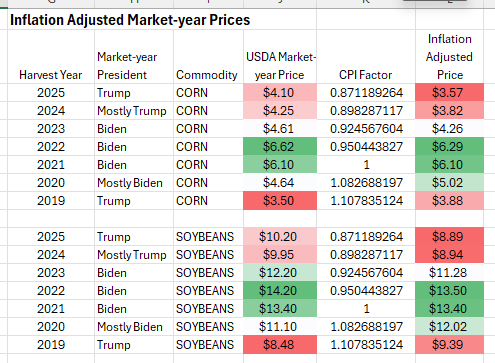
We start by adjusting the market year prices for inflation. At a per-bushel level over seven years this is not hugely important. If we are to look at overall income, however, we have to multiply per-bushel prices by total production. A ten-cent price difference multiplied times 2.5 billion bushels of corn is 250 million dollars. To avoid this variance, we used the Consumer Price Index (CPI) for all Midwestern urban consumers to standardize dollar values across the period.

We made the assumption that USDA market year prices were representative of prices at the midpoint of the market year. We then averaged CPI indices for February and March of the years 2020 to 2026 to coincide with the midpoints of the 2019 to 2025 market years. We then used those averages to standardize our USDA market year prices on the dollar value at the midpoint of 2021 market year (February-March of 2022). The year was chosen because it matches the current set-up of the economic impact model we will be using below. It has no effect on results.

Inflation adjusted prices are shown in the table below. Once again, the prices were placed on a color-gradient scale.
Adding Production, Realized Income, and a Weighted Average Price

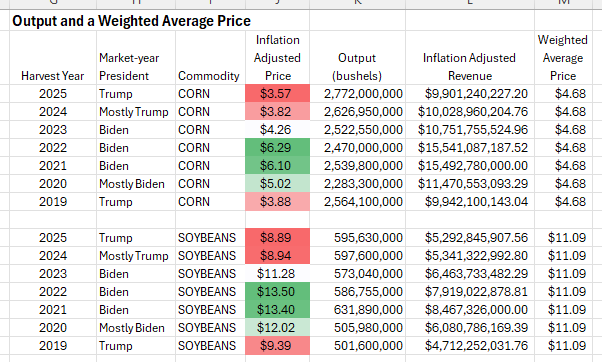
To get to total incomes related to the price variations we see, we add bushel output for both corn and soybeans through the period. Output numbers are from the USDA and represent the harvest years coinciding with the market year prices utilized above.

To generate income or realized revenue, we simply multiplied inflation adjusted prices times output levels to get inflation adjusted revenue for each crop year.

Then we divided the sum of inflation adjusted revenue by the sum of output across the seven years to generate a weighted average price for the overall period. Our weighted average price for corn is $4.68 per bushel. For soybeans, $11.09 per bushel. Both weighted average prices are denominated in dollar values current at February-March 2022.
The Difference Between Realized Revenue and Baseline Revenue

We used realized income in the table above to generate a weighted average price for both corn and soybeans across the seven-year period. The weighted average price can be used as a baseline of sorts to reflect expectations. We can multiply the weighted average price times annual production values to get a baseline revenue value or expected revenue relative to any year’s production volume.

We can then subtract our calculated value of baseline revenue from our calculate value of actual inflation adjusted revenue to generate a measure of realized farm revenue divergence.

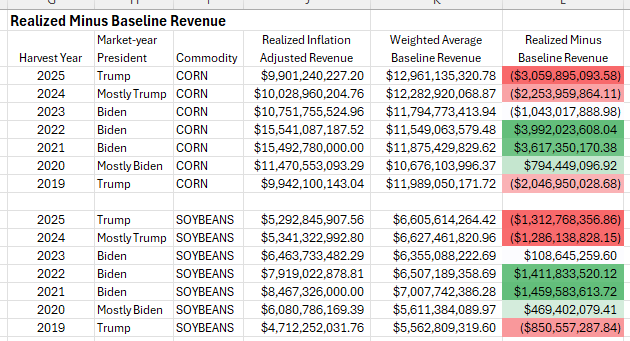
We have done that in the table below. We have used Excel to place a color gradient on the series. Red represents a large negative divergence (expectations are much higher than realizations). Green represents large positive divergence (expectations are much lower than realizations).

For corn, our divergences of realized to expected revenues ran from a deficit of over $3 billion to a surplus of nearly $4 billion – a spread of nearly $7 billion.

For soybeans, our divergences of realized to expected revenues ran from a deficit of $1.3 billion to a surplus of nearly $1.5 billion – a spread of nearly $2.8 billion.

These variations all represent farm income. At this point, we have made no assumptions or estimates on how these farm income fluctuations will affect the surrounding non-farm economy. They will have an effect, however. When farm incomes are flush, farmers spend extra money on new vehicles, recreation, goods, and services. When farm incomes are short, farmers economize on these expenditures.
Non-farm Impacts of Farm Revenue Variations

Because we are working only with final price variations and production is fixed, we can look at this variation in farm revenue as variations in farm family income. By the time commodity prices are established, all farm production activities and expenses have been realized. The economic impact of production is fixed. The economic impact of these income variations are entirely due to changes in the expenditures of farm families in the economy around them.

To get at this, we first combined the corn and soybean variations for every year (the far-right column of numbers in the table above). Then we ran these summed variations in farm income for every year through an economic impact model generated with Regional Input-Output Multiplier System coefficients from the U.S. Bureau of Economic Analysis (BEA). We then used the CPI to adjust the dollar values to reflect dollar values at the midpoint of the 2025 market year (February-March 2026) to bring the values into line with current price experience.

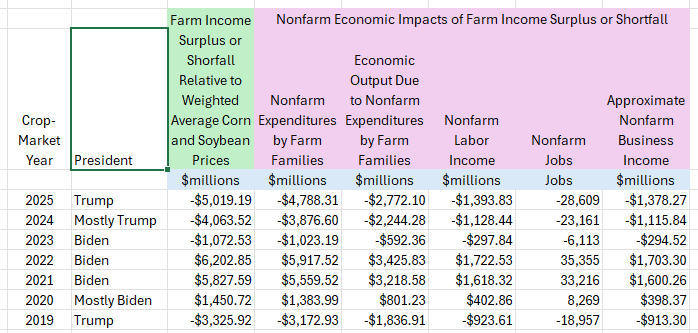
The results of this are shown in the table below. The first column of numbers (under the green-shaded heading) is the sum of the corn and soybean income variations from the table above after adjusting to February-March 2026 dollar values. This is the effect that revenue surpluses or deficits from our weighted average price directly affect farm families in Iowa. In the 2025 line, this figure reflects a shortfall of slightly over $5 billion in Iowa farm income relative to expectations based on our weighted average prices for corn and soybeans.

The next five columns (under the plum-shaded headings) show the off-farm impact of these farm income variations. The first of these columns shows changes in non-farm expenditures by farm families. In the 2025 row, for example, we see that a farm income shortfall of just over $5 billion is expected to result in a nearly $4.8 billion reduction in farm family expenditures. This is money that is not received by businesses like auto dealers, grocers, dance studios, and restaurants around Iowa.

Of this $4.8 billion that Iowa businesses do not receive from farm families, nearly $2.8 billion is value that would have been created within the Iowa economy – “Value Added” in the language of economists. The remaining $2 billion would have consisted of goods and services imported from outside of Iowa.

The $2.8 billion in lost Iowa economic activbity would be split nearly evenly between labor income ($1.39 billion that would have supported over 28,000 jobs) and business income ($1.38 billion worth of business earnings, interests, rents, and a very small sliver of indirect business taxes).

You can run across any of the crop-market year lines and build a similar story. The column with the green-shaded heading represents the direct effect of expected price shortfalls on farm income. The columns with the plum-shaded headings shows how reduced farm income translates into reduced off-farm expenditures, payrolls, jobs, and business income.

Conclusion

This all started with a few farmers remarking that farm prices, while bad, are a couple of dollars higher than they were under President Biden. Even though it is easy to demonstrate that they are wrong, these farmers are sincere in their beliefs in this regard.

As a talking point, a couple of dollars on a bushel of corn or soybeans passes most of us without generating an awareness of billions of dollars in lost economic activity. This is unfortunate.

When we can promote simple erroneous statements as political talking points and ignore the fact that those erroneous statements mask billion-dollar swings in personal income and economic activity, we are encouraging people to vote in ways that are in direct opposition to their own self interests and the interests of their neighbors.

Nothing is more detrimental to faith in government than false political narratives that are demonstrably harmful to the very people they are targeted at.
The Federal Shutdown and Iowa

It’s October 3, 2025, and the federal government shut down two days ago for lack of budget legislation. It was not a surprise. Republicans holding power in the House of Representatives, the Senate, and the White House have made it a point not to negotiate a resolution, either among themselves (they had the power to resolve this all by themselves) or with the opposition party.

Citizens in the United States are becoming so used to dysfunctional federal government that the whole affair was met with a collective yawn on October 1. The pain will not hit immediately, and, when it does, most citizens believe it will not fall directly upon themselves.

Citizens in the United States have become so self-indulgent that pain which does not fall directly upon themselves does not matter.

In that context, all the follows may be a waste of time and computational effort. What follows is a quick look at the ongoing costs of a federal government shutdown on the state of Iowa. Iowa was picked because I am familiar with the data and I have a recently constructed economic impact model for Iowa. Similar calculations could certainly be done for any state.

The analysis will be done on the basis of a one-day shutdown. Results can be multiplied by the number of days the shutdown lasts to approximate total costs to the Iowa economy. Wherever possible, I will try to bring effects back to numbers of jobs lost.

To put this in perspective, over the past ten years, from December 2014 to December 2024, Iowa had a net gain of just 10 nonfarm jobs per day. Over the past year, from December 2023 to December 2024, Iowa had a net loss of 15.5 nonfarm jobs per day.

Federal Jobs

The first loss Iowa will see from a shutdown is the idling of federal employees. Iowa has about 18,400 federal civilian employees (Bureau of Labor Statistics – BLS). Most of them will be idled as nonessential workers. These employees generate an Iowa payroll of a little over $524,000 per workday (Bureau of Economic Analysis (BEA) and BLS). Like the rest of us, they spend their earnings on groceries, cars, clothes, dance lessons, and what-not.

When that payroll money does not get spent, someone else in Iowa doesn’t receive it. In general, taking half a million dollars out of Iowa payrolls will result in a loss of about 3.5 jobs. That means Iowa can expect to lose 3.5 jobs for every day the shutdown lasts. This is in addition to the 18,400 federal workers idled by the shutdown. This is a loss to the rest of us because those federal workers are not being paid and are not spending their earnings in the local economy.

Remember, over the past ten years, Iowa has generated only ten new nonfarm jobs per day.

Finally, this is not just workers. Idling federal workers will cost Iowa nearly $150,000 in business earnings (profits, rents, interest, etc.) for every day the shutdown continues. This is entirely from the effects of the unspent federal payrolls. This does not include the losses of federal contract or supply receipts or federal direct payments.

Direct Farm Payments

According to the Environmental Working Group, Iowa farmers received $43.5 billion dollars in direct payments over the past 30 years. This works out to an average of nearly $4 million per day, ever day, over the period. Because crops have already been cultivated this year, this is also best looked at as a subtraction from farm family incomes.

If we remove these sums from farm family incomes, farm families, like the federal employees above, will not be able to spend their funds on cars, houses, groceries, and what-not. This drop in expenditures means other Iowa families will not receive these expenditures as income.

The result of all of this is that reducing farm family expenditures by $4 million will reduce Iowa’s total employment by 26 jobs. It will reduce Iowa business earnings by $1.1 million.

On average, this will happen every day of the shutdown. The model is linear. The results can be multiplied by the number of days the shutdown lasts.

Remember, this will be in addition to the initial $4 million daily loss in farm family income.

Social Security Benefits

According to the BEA, Iowans received $15.5 billion in Social Security payments during 2024. This works out to an average of $42.5 million per day. This, too, is an addition to family income. When it does not arrive, recipients do not spend it on groceries, medical care, vacations, cars, and what-not. This reduces the incomes of Iowans who would normally supply these things to the recipients.

Reducing Iowa household income by the loss of daily potential Social Security payments would cost Iowa 278 jobs for every day that a shutdown stops Social Security payments. It would also cost Iowa businesses $11.7 million in lost earnings – every day that Social Security payments are not received. This is on top of and completely separate from the hardships imposed on Social Security recipients.

Medicare and Medicaid

The BEA reports that Medicare and Medicaid pumped $19.5 billion into the Iowa healthcare industry in 2024. This averages $53.2 million per day.

Unlike the impacts calculated above, these sums are not properly looked upon as changes to household income. Medicare and Medicaid payments are direct purchases of services from the healthcare industry.

Splitting these expenditures across the segments of the healthcare industry in Iowa results in a loss of 612 jobs for every day’s loss in Medicare and Medicaid expenditures in Iowa. It also results in the lose of approximately $21.7 million in business earnings across the state.

These estimates can be multiplied over the days payments are eliminated during a government shutdown.

These estimates are above and beyond the hardships imposed on recipients who are denied healthcare, and they are above and beyond additional costs that result from healthcare being denied.

Roll It All Together

Summing up the impacts laid out above, each day’s loss of the federal funding would cost 920 jobs and $34.6 million in business earnings. This would be above and beyond the direct loss of incomes and services to the initial recipients of the funds.

This would be multiplied every day receipts and services are lost due to a federal government shutdown.

Unlike a layoff at John Deere or some other manufacturer, however, these losses will be spread across businesses throughout Iowa and will not be reported to the Iowa Department of Workforce Development as mass layoffs. They will not be reported in the media the same way a mass layoff would be reported.

It will start as reduced hours, lost shifts, and scattered individual job losses, but the steady march of reduced expenditures, incomes, and employment will be insidious. The victims will be largely invisible except to their own small circles of family and friends.

And On and On and On We Go

Without going on ad nauseum, this is not all of it. According to Common Good Iowa, in 2024

  • The USDA spent $916.6 million in Iowa beyond direct farm payments  
  • The Department of Commerce spent $1.4 million 
  • The Department of Education spent $676 million 
  • The Department of Energy spent $7.6 million 
  • The Environmental Protection Agency spent $139.1 million 
  • The Department of Health and Human Services spent $795.4 million in addition to its Medicaid outlays 
  • Homeland Security spent $11 million 
  • Housing and Urban Development spent $77.2 million 
  • The Department of the Interior spent $30.5 million 
  • The Justice Department spent $17.3 million 
  • The Department of Labor spent $60.2 million 
  • The National Endowment for the Arts and Humanities spent $1.9 million 
  • The Department of Transportation spent $934.6 million

It all totals another $3.77 billion in federal spending in Iowa – an average of over $10 million per day. All of this could also be allocated to industries and run through an economic impact model, but you get the idea.

Most of us won’t directly feel the effects of a federal shutdown unless it lingers for some time. Although scattered, however, those impacts are larger on a daily average basis than the largest mass layoff reports that regularly make headlines in Iowa.

The invisibility of the victims magnifies the cruelty of these impacts and the irresponsibility of the people who made the shutdown a reality.

An Inquiry into Farmland Value Streams

We are doing some work on farm and farmer value streams here at Regional Strategic, Ltd. The pilot work is using Iowa, but the intent is to take what is found and expand the work across the Upper Midwest.

One of the first major questions regards farmland valuation and appreciation. The graph below shows a simple relationship that leads to a number of complex questions. The graph shows cumulative inflation-adjusted value streams for ag land appreciation (from Iowa State University’s Farmland Value Survey), direct government payments (from the Bureau of Economic Analysis), and farm income net of government payments (derived from the Bureau of Economic Analysis) per acre of farmland (from the Census of Agriculture).

The period runs from 1993 to 2022. The scenario assumes that an acre of land is purchased in 1992 and the purchaser initiates production in 1993. The three lines show accumulations of income and land appreciation over a 30-year period. The endpoint is set as the last year in which complete stable information was available from the Bureau of Economic Analysis.

The first thing that jumps out is that accumulated land value appreciation outruns operating income and direct government payments. Accumulated land appreciation separates from the other two streams in 2002. In addition, Operating income breaks out above direct government payments in 2007.

Over the thirty years, the three inflation-adjusted value streams generated an average of $458 per year. Averages for each of the components were

Of this average value stream, only 38 percent came from income, and nearly a third of this income was in the form of direct government payments. Operating income accounted for only a little over 26 percent of the value stream generated by an average acre of Iowa agricultural land.

Average farm earnings net of government payments (operating income) was only sufficient to pay a 4.72 percent return on the 1992 purchase price of $2,559. Operating income plus direct government payments were only sufficient to pay 6.86 percent return to purchase price. This is all barely enough to cover interest or carrying cost on the investment.

Given these low production returns, what makes land price appreciation average 11.5 percent per year?

What caused land appreciation rates to break away from operating income and direct government payments in 2002?

What caused operating income to break away from direct government payments in 2007?

A portion of these relationships might simply be the result of the period being observed, but the size and consistency of the breaks suggest there is something more. There appears to be a confidence in the value of Iowa farmland that overrides observed farmland productivity. Why is that?

  • Is it due to indirect subsidies?
  • Is it due to the conviction that subsidies and relief will always maintain farm income?
  • Is it because of a belief that the removal or reduction of farm subsidies, both direct and indirect, will inordinately affect other production areas and concentrate production and value in Iowa?

We honestly don’t know the answers to these questions. That is the point of the inquiry. More will come as we noodle this out.

Interested in Learning More About Regional Strategic, Ltd.? Send Us a Message